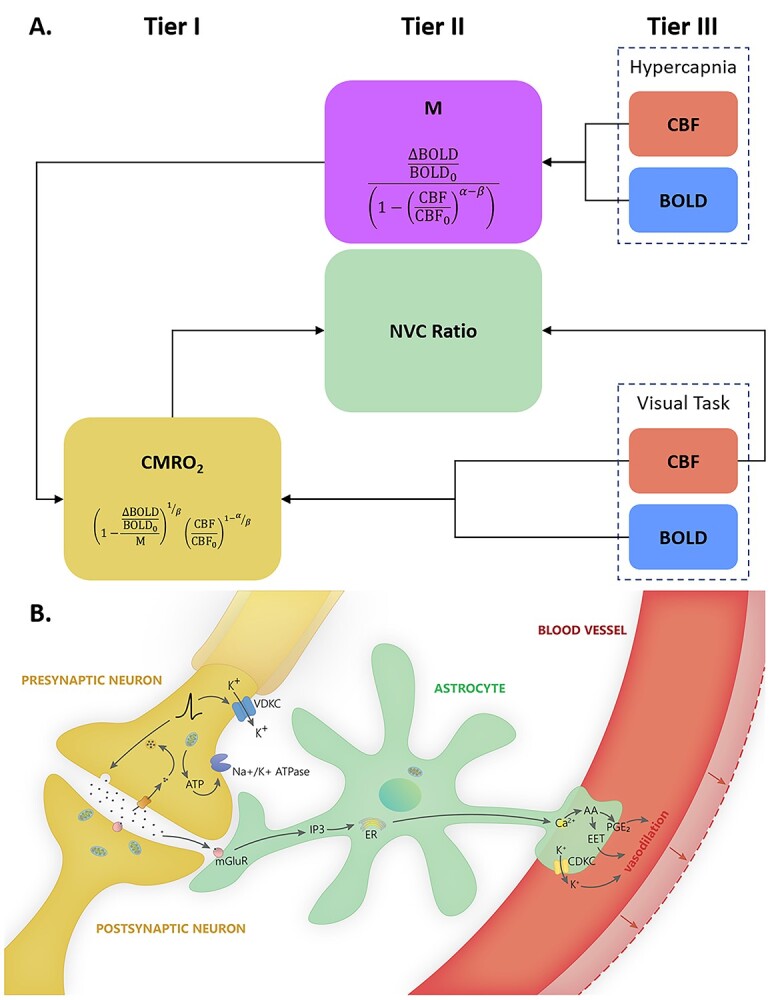
Fig. 3.

(A) Schematic for the calculation of M, CMRO2, and NVC ratio. Relative CBF and BOLD measured during hypercapnia are used to calculate M (the theoretical ceiling of BOLD signal change), which can be combined with relative CBF and BOLD measured during the visual task to calculate relative CMRO2 (and NVC ratio). (B) Each tier of the neural-glial-vascular model can be represented by one measure: CMRO2 (tier I) represents neurometabolic activity, CBF (tier III) represents vascular responses to changes in that activity, and the NVC ratio (tier II) represents the intermediaries that link blood flow and metabolism.
