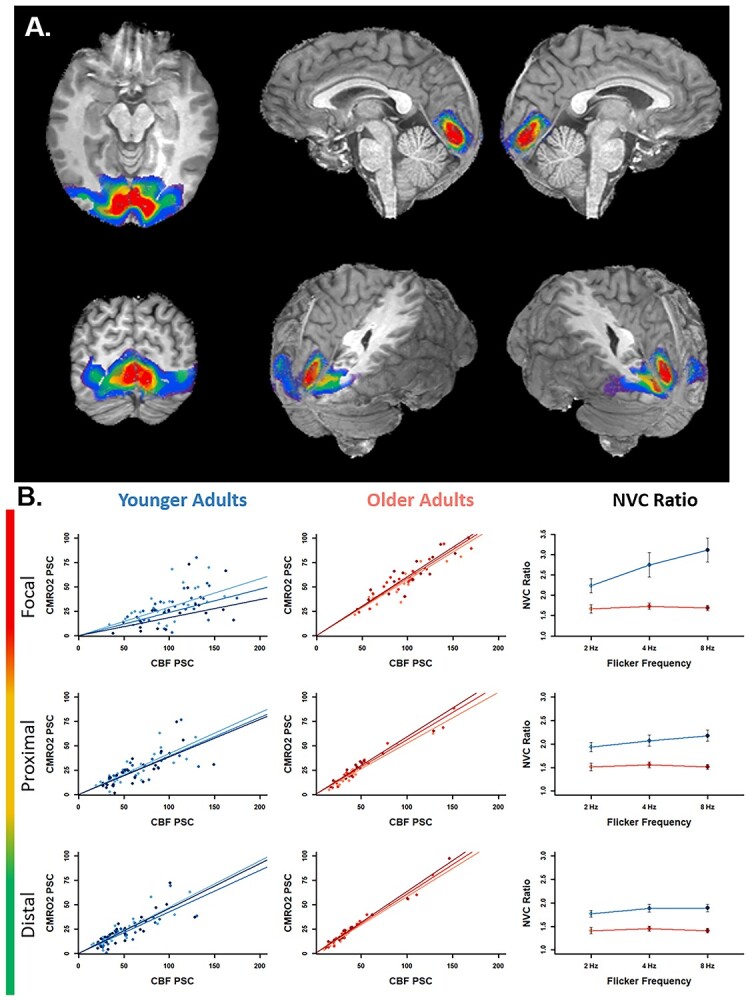
Fig. 5.

A) ROIs from a representative participant. Colors indicate the size of the maximum extent of the ROI: Focal (red; 5,000 mm3), proximal (yellow; 10,000 mm3), and distal (green; 20,000 mm3). Also depicted for reference are more outlying ROIs in blue (30,000 mm3) and purple (40,000 mm3). B) The first 2 columns depict PSC values of CMRO2 by CBF for each frequency in younger (left) and older (center) adults, and the right column depicts the NVC ratio for each group at each frequency, calculated as the reciprocals of the by-condition parameter estimates from the left two columns. Each row depicts results for each of the focal (top), proximal (middle), and distal (bottom) regions corresponding to representative ROIs above in red, yellow, and green, respectively. Results for younger adults are represented in blue, and those for older adults are represented in red. Lighter and darker shades represent lower and higher frequency conditions, respectively. Error bars in the right column represent the extent to which individual observations vary from the least-squares regression line in the left and center columns for younger and older adults, respectively, and were calculated using Equation (4) (see Materials and methods). Greater variability was observed in younger adults.
