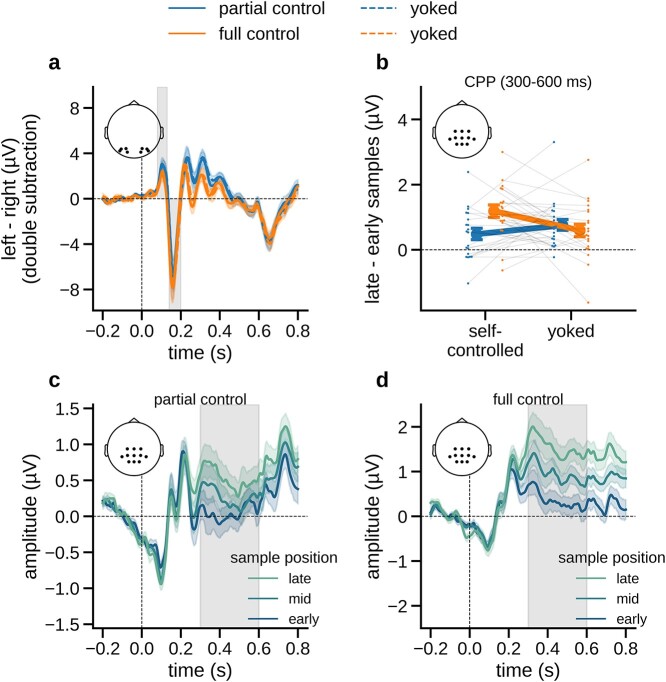
Fig. 2.
Univariate EEG results with ERPs time-locked to number sample onset. a) Early visual ERPs (left − right stimuli, right channels subtracted from left channels) in each sampling condition. Gray shadings indicate time windows of the P1 and N1 components, respectively (80–130 ms and 140–200 ms). b) The difference in centro-parietal (CPP) amplitudes between samples occurring late versus early in the trial (see panels c and d), plotted separately for each sampling condition (including yoked). c) The “ramping up” of CPP amplitudes (0.3–0.6 s) over early, mid, and late samples in the partial control condition. Gray shadings indicate the time window from which average amplitudes were extracted in panel b. d) Same as c, for the full control condition. Error indicators in all panels show SE.

