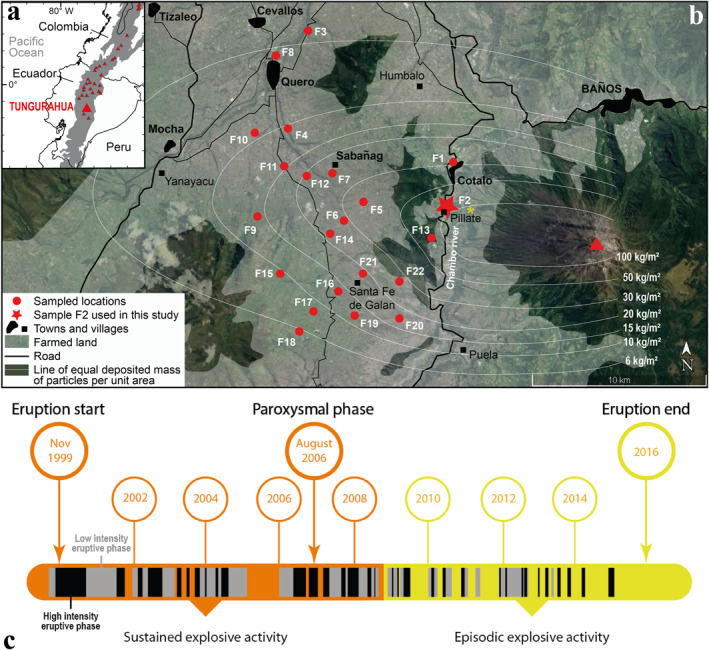
Figure 1.

(a) Location map of Ecuador and Tungurahua volcano in the Andean Cordillera (gray shaded area). (b) Agricultural area around Tungurahua volcano (red triangle), and locations where the fallout deposit of the 16–17 August 2006 eruptive phase was sampled. The lines of equal deposited mass of particles per unit area during this phase are mapped (white lines) and represent the spatial variations of the amount of particles on the ground. The land in the area is farmed (white transparent area) to the middle of the slope of the Tungurahua volcanic edifice (see also the photograph in Figure 2a). Location of photograph in Figure 2b is reported by a yellow star. Base‐map layer from Google maps. (c) Chronology of the 1999–2016 Tungurahua eruption showing the duration of each explosive eruptive phase and the main changes in intensity (black vs. gray eruptive phases) and steadiness (orange vs. yellow time periods) of the overall activity. Note that the term “eruption” refers to the whole 1999–2016 eruptive period, while “phase” corresponds to the shorter, alternating periods of variably intense explosive activity within the whole duration of the 1999–2016 eruption. Each high (black slots) and low (gray slots) intensity eruptive phase was characterized by explosive plumes reaching an altitude of at least 1 km above the vent and depositing particles in the area defined in (b). After Hidalgo et al. (2015) and Muller et al. (2018).
