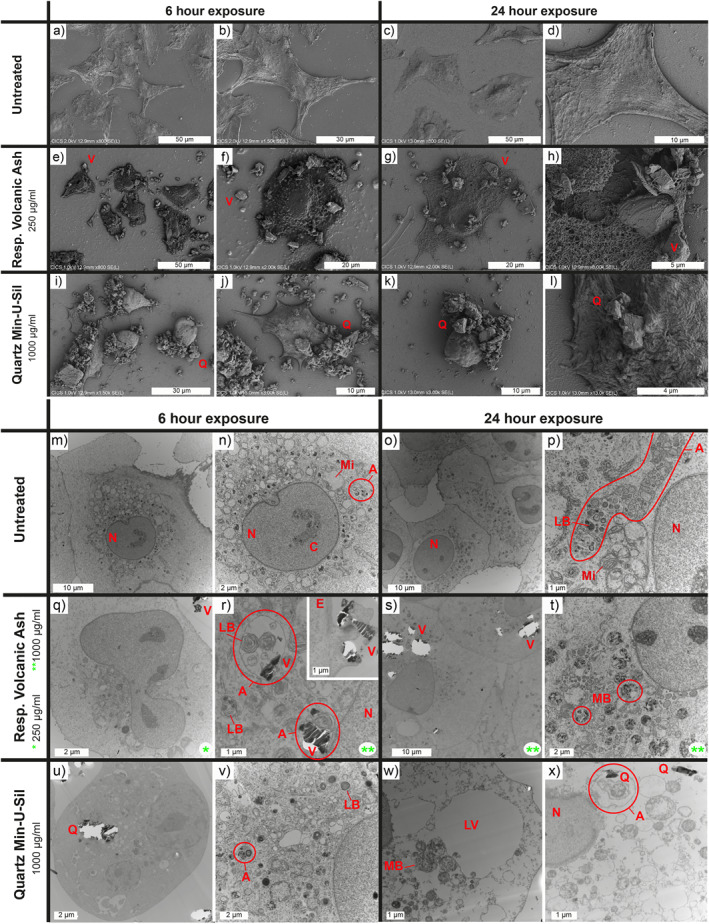
Figure 6.

Interactions between A549 cells and respirable Tungurahua volcanic ash or quartz particles imaged by (a–l) FEG‐SEM and (m–x) TEM. (a–l) Morphological changes observed after 6 and 24 hr between untreated A549 cells and cells treated with respirable volcanic ash or Min‐U‐Sil quartz positive control. Representative images of cells treated with volcanic ash at 250 μg/ml are solely presented here because they offer a better view of the cells and the particles, but no major differences in terms of morphology and surface features are observed between cells treated at 250 and 1,000 μg/ml (Figure S1 in Supporting Information S1). Q, quartz particles; V, respirable volcanic ash. (m–x) Intracellular changes observed after 6 and 24 hr between untreated A549 cells and cells treated with respirable volcanic ash or Min‐U‐Sil quartz positive control. Like with the SEM images, no major differences are observed between cells treated with 250 and 1,000 μg/ml of volcanic ash (Figure S2 in Supporting Information S1). Green stars indicate treatment dose of volcanic ash (*250 μg/ml, **1,000 μg/ml). White bright spots are due to tears in the ultrathin sections caused by the hardness contrast between the particles and the cells during cutting. A, autophagosomes/autophagolysosomes; C, chromatin; E, endocytosis; LB, lamellar bodies; LV, lysis vacuoles; MB, microvesicular bodies; Mi, mitochondria; N, cell nucleus; Q, quartz particles; V, respirable volcanic ash.
