Figure 7.

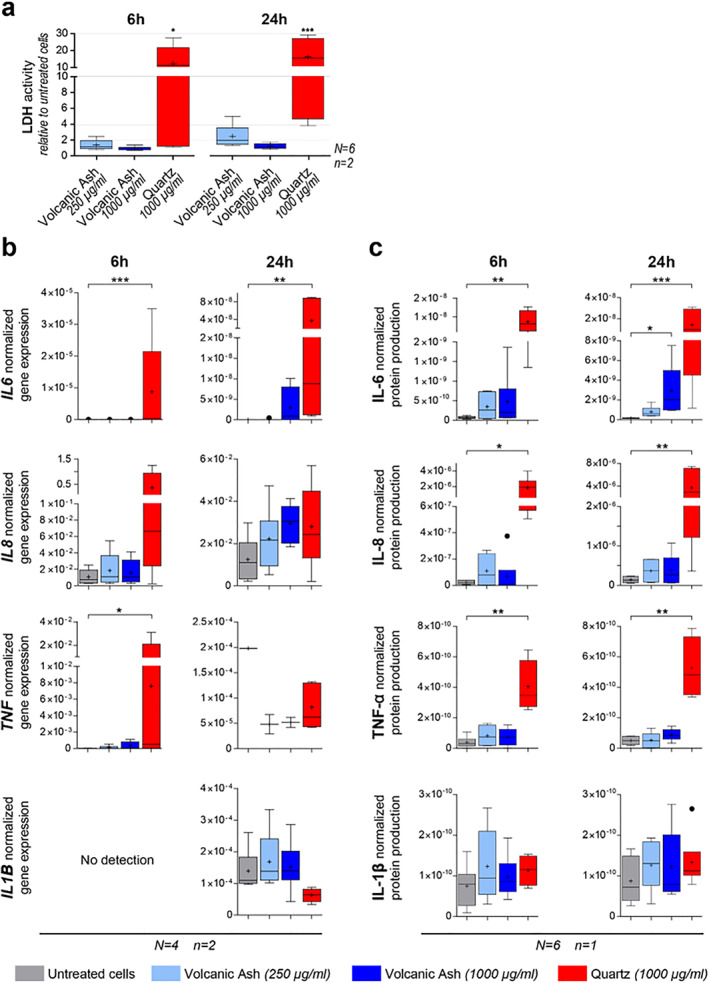
(a) Cytotoxicity toward A549 cells of the respirable Tungurahua volcanic ash sample at two concentrations and the Min‐U‐Sil quartz positive control after 6 and 24 hr of exposure, measured by LDH activity relative to untreated cells in duplicates (n = 2) of six independent experiments (N = 6). (b–c) Pro‐inflammatory response measured by cytokine production by A549 cells after 6 and 24 hr of exposure to two concentrations of the respirable Tungurahua volcanic ash and the Min‐U‐Sil quartz positive control. (b) Cytokine gene expression by real‐time RT‐qPCR on duplicates (n = 2) of four independent experiments (N = 4). Gene expression is normalized to the geometric mean of the expression of two housekeeping genes. (c) Cytokine production measured in culture supernatants by automated multiplex immunoassays on Ella™ on the pooled duplicates (for n = 1) of six independent experiments (N = 6). Protein production presented as the cytokine concentration normalized to the total protein concentration. Boxplots in (a–c) are Tukey boxplots with the mean represented as a cross and the median as a horizontal line. *p ≤ 0.05, **p ≤ 0.01, ***p ≤ 0.001.
