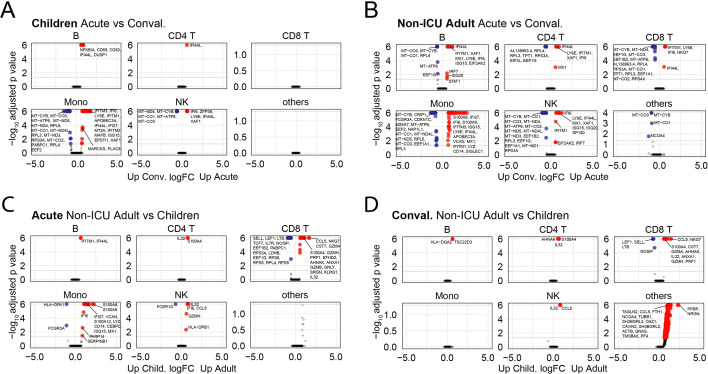
Supplementary Fig. S4.
Volcano plots showing top 50 differentially expressed genes. Significantly upregulated genes are shown in red and downregulated genes in blue.
(A) Between acute and convalescent samples in children.
(B) Between acute and convalescent samples in non-ICU adults.
(C) Between non-ICU adults and children in the acute phase.
(D) Between non-ICU adults and children in the convalescent phase.

