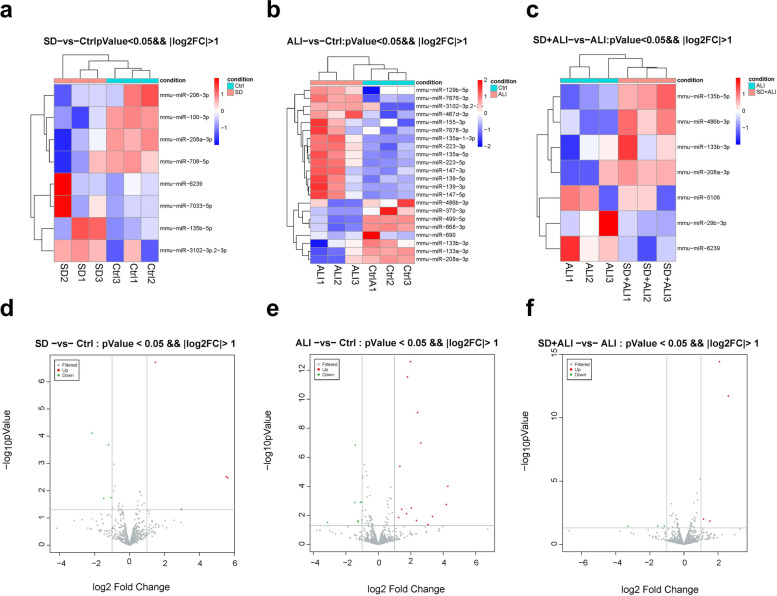
Fig. 7.
The distinct miRNAs expression profiles between groups. a The heat map represents hierarchical clustering for DE miRNAs between the SD group and Ctrl group; b The heat map represents hierarchical clustering for DE miRNAs in the ALI group compared with the Ctrl group; c The heat map represents hierarchical clustering for DE miRNAs in the SD + ALI group compared with the ALI group. d The volcano plots for DE miRNAs in the SD group compared with Ctrl group; e The volcano plots for DE miRNAs in the ALI group compared with the Ctrl group; f The volcano plots for DE miRNAs in the SD + ALI group compared with the ALI group. Up-regulated expression was indicated as “red”, and down-regulated expression was indicated as “green”

