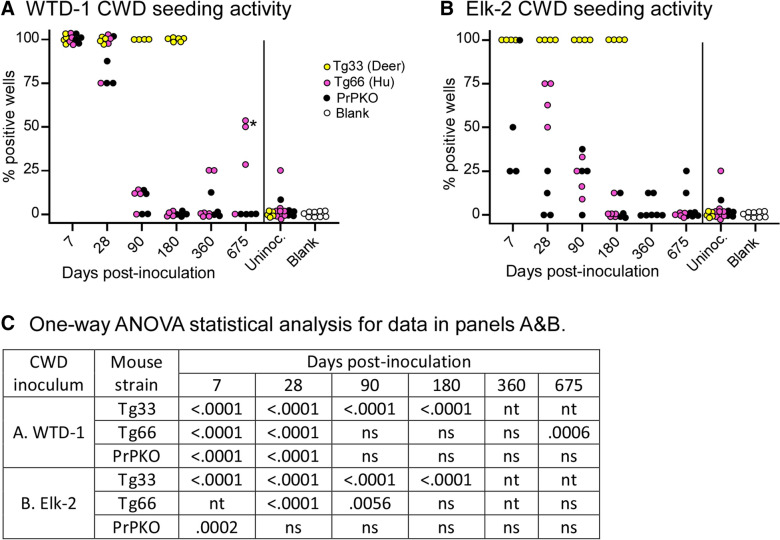
Figure 1.
Clearance of prion seeding activity at various times following intracerebral inoculation of CWD. Panels A&B, RT-QuIC data showing the percentage of assay wells positive for prion seeding activity at several times post intracerebral inoculation with WTD-1 (A) or Elk-2 (B) CWD. Mouse strains are indicated with different colored circles, each circle represents data from an individual mouse brain. Each brain was assayed using a minimum of 4 replicate wells for the 7 and 28 day time-points and an 8 well minimum at all time points of 90 days and longer. The asterisk in panel A indicates two mice that were statistically different (P < 0.05) versus uninoculated controls using the Fisher’s exact T-test. C. Additional statistical analysis was performed using Dunnett’s multiple comparisons test (One-way ANOVA). Strains of mice were tested independently, all time-points within a strain were compared to the uninoculated control mice of that specific strain. P-values that were < 0.05 are provided; ns, not significant; nt, not tested. The uninoculated mice shown are from each of the three mouse strains tested and mice were euthanized at several different times. Age information for these control mice can be found in Additional file 2. In the blank column, each circle represents data from quadruplicate RT-QuIC assay reactions that were not seeded with any brain homogenates and included as controls for spontaneous reactions from the substrate.

