Fig. 2.
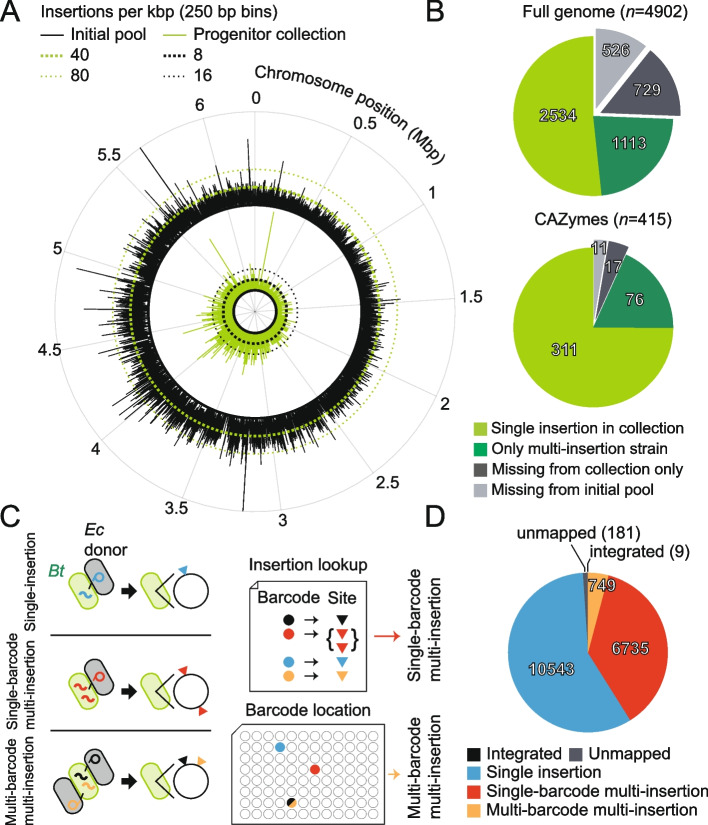
The progenitor collection covers a large fraction of the genome. A Patterns of transposon-insertion density across the chromosome were largely similar between the initial pool and the progenitor collection. The insertion density across the chromosome is plotted for the initial pool (~120,000 insertions that map to the genome; outer circle, black) and the progenitor collection (~11,000 insertions; inner circle, green). The number of barcodes detected in the initial pool used for sorting was smaller than the total detected in the original random pool, presumably due to loss of strains during passaging. Insertion density was calculated from the number of uniquely barcoded transposons in 250-bp bins and does not reflect the relative abundance of individual barcodes. Only single-insertion strains were considered when calculating insertion density for the progenitor collection. B Coverage in the progenitor collection of the B. theta genome (top) and the carbohydrate active enzyme (CAZyme, bottom) functional category. Genes with single-insertion strains were candidates for inclusion in the condensed collection (light green). Some genes were only covered by strains with multiple insertions (dark green), and some had no representative insertions in the initial pool and thus were unlikely to be captured (light gray). Other genes were covered in the initial pool but not captured in the progenitor collection (dark gray); these genes are likely to be accessible with larger collection sizes or with alternative sorting parameters. n specifies the number of genes. C A schematic connecting the types, causes, and classification of multi-insertion strains. Multiple transposons transferred from the same donor cell during conjugation (red squiggles) are likely to share a barcode, potentially leading to multiple insertions that share a single barcode (red triangles, single-barcode multi-insertion). Transposons transferred to the same cell from multiple donors (orange and black squiggles) are likely to carry unique barcodes, leading to multiple insertions with unique barcodes (orange and black triangles, multi-barcode multi-insertion). Single-barcode multi-insertion strains can be detected within the insertion lookup table as an association between one barcode and multiple insertion sites. Multi-barcode multi-insertion strains can be detected as two barcodes that share the same location in the collection. However, multi-barcode multi-insertion strains cannot be detected in the insertion lookup table, nor can single-barcode multi-insertion strains be detected in the barcode location table. D Classification of strains from the progenitor collection according to the number of insertions. Integrated (sequencing past the transposon end mapped to the original plasmid sequence) and unmapped (no sequence information on barcode insertion site) insertion strains were a minority. Most strains were classified as single insertion (light blue). Single-barcode multi-insertion was the second most common classification (light red) and multi-barcode multi-insertion was the third most common (gold)

