Fig. 3.
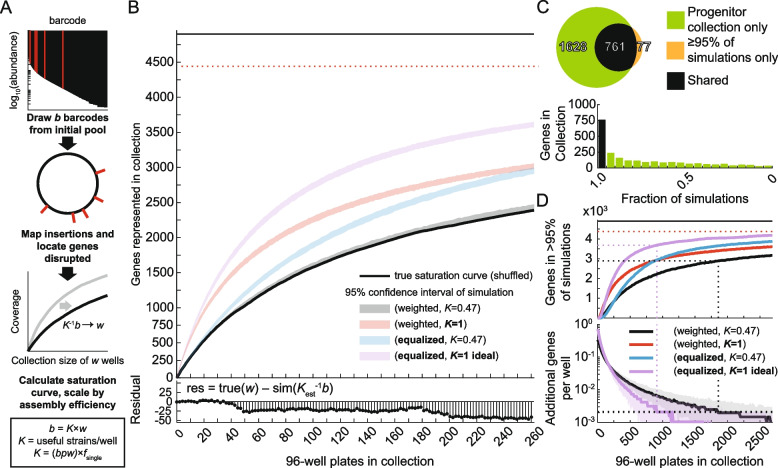
Simulations reveal factors that limit genome coverage in the progenitor collection. A Workflow for simulating genome coverage in the progenitor collection. BarSeq was used to estimate the identity and abundance of insertions in the initial pool used for sorting. Relative barcode abundance was used as a probabilistic weight to draw b barcodes from the initial pool. The insertions associated with each barcode were located on the genome and compared to the genome annotation to determine the coverage (the number of genes disrupted) of the simulation. To model the coverage of a collection of w wells, we estimated the assembly efficiency (K, the fraction of wells with a useful barcode): we counted the number of barcodes per well (bpw), then factored in the requirement that the barcode had to be associated with a single insertion at a defined genome location. We scaled the collection size in the simulations by K−1 to account for assembly efficiency. B (Top) The experimental saturation curve (black) is plotted along with 95% confidence intervals of simulated saturation curves. The total number of genes (4902) and the total number of genes covered by the initial pool (4374) are shown as black and dashed red lines, respectively. A saturated collection would have coverage that approaches the number of genes in the initial pool. Using the initial pool composition determined by BarSeq and accounting for the assembly efficiency of the collection allowed us to accurately model the true saturation curve (weighted, K=0.47). Hypothetical collections with perfect assembly efficiency (K=1), unbiased initial pools (equalized), or both resulted in collections with higher coverage. (Bottom) Fit residuals between the true collection (true(w)) and the simulated saturation curve sim(Kest−1b) obtained by scaling the simulation by the value of K estimated from the collection statistics. C (Top) The overlap between the genes covered in the 262-plate collection and the genes predicted to occur in ≥95% of 250 simulations of the same size is high. While the simulated gene set was largely represented in the 262-plate collection, the larger gene set of the 262-plate collection also contains many genes predicted to be covered at low confidence. (Bottom) Many genes in the collection were present in <95% of simulations (green bars), supporting the conclusion that the 262-plate collection has not reached saturation. D Simulations of larger collection sizes predict the requirements for reaching saturation. (Top) The number of genes that occur in ≥95% of 250 simulations is predicted to saturate within 2680 plates only with both ideal assembly efficiency and equalized barcode abundance (equalized, K=1; purple line). The horizontal red dashed line represents the total number of genes covered by the initial pool, the saturation limit of any ordered collection. The black and purple dashed lines track collection size statistics for the original (weighted, K=0.47) and ideal (equalized, K=1) simulations, respectively, with a heuristic practical limit on collection size, as described below. (Bottom) The incremental increase in coverage per well added to the collection can be used to guide the practical size limit of progenitor collections. For example, at a hypothetical incremental efficiency of <2×10⁻³ (horizontal dashed line), an additional 10 96-well plates will only isolate 1–2 additional genes. The collection sizes of both the original (weighted, K=0.47; black dashed line) and ideal (equalized, K=1; purple dashed line) simulations at this hypothetical limit are represented as vertical dashed lines

