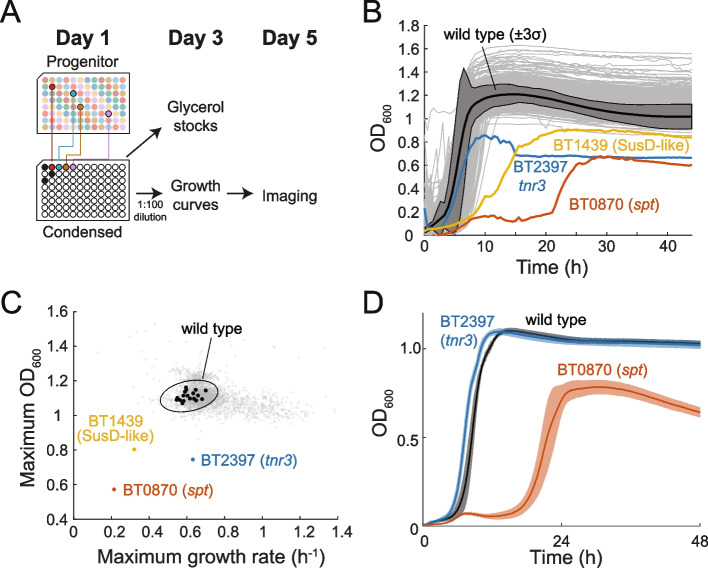
Fig. 4.
High-throughput screening reveals a small set of mutants with growth defects. A Schematic of the pipeline for measuring growth and cell shape phenotypes of the mutants in the condensed collection. B Growth in BHIS was similar to wild type for the vast majority of mutants (gray curves). BT0870 (spt, sphingolipid synthesis, red), BT2397 (tnr3, thiamine scavenging, blue), and BT1439 (SusD-like, yellow) mutants exhibited growth defects. The average of all wild-type growth curves is shown in black with the dark gray shaded region representing 3 standard deviations. C Most mutants exhibited similar maximum growth rate and maximum OD600 as wild type. Wild-type replicates (black circles) exhibited a similar spread as most of the mutants. All mutants except the outliers described in B are shown in gray. The oval indicates 3 times the standard deviations and covariance. D After passaging through a colony, the growth phenotype of the BT0870 (spt) mutant from the progenitor collection was maintained, while the BT2397 (tnr3) mutant reverted to approximately wild-type growth. Solid lines are averages, and shaded regions indicate 1 standard deviation of n=6 biological replicates

