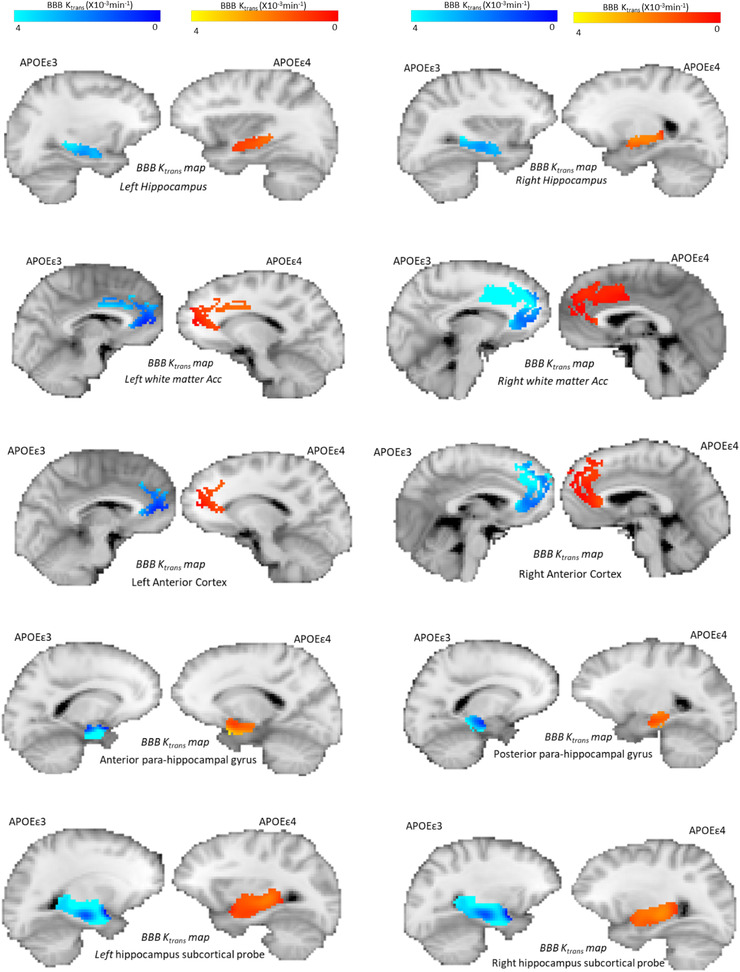
FIGURE 3.

Representative Ktrans maps in 10 brain regions from individual APOEε3 (dark/light blue, n = 19) and APOEε4 (red/yellow, n = 17) carriers. The maps are overlaid on T1‐weighted contrast images in the native space of the participants. Regions: left hippocampus, right hippocampus, left white matter anterior cingulate cortex, right white matter anterior cingulate cortex, left anterior cortex, right anterior cortex, anterior parahippocampal gyrus, posterior parahippocampal gyrus, left hippocampus subcortical probe, and right hippocampus subcortical probe. The regions‐of‐interest (ROIs) and brain images were taken from individual participants carrying either APOE ε3 or APOEε4 genotype.
