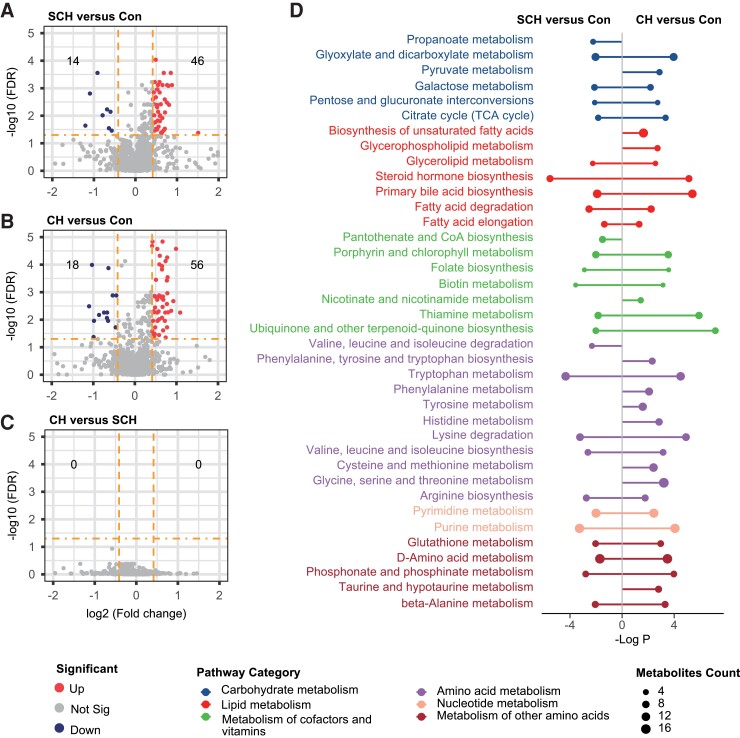
Figure 2.
Differential metabolites and disturbed pathway. A, Volcano plot shows altered metabolites between CH and Con, which increase (red, FDR<0.05 and fold-change >4/3) or decrease (blue, FDR <0.05 and fold-change <3/4) in CH. B, Volcano plot shows altered metabolites between SCH and Con, which increase (red, FDR<0.05 and fold-change >4/3) or decrease (blue, FDR<0.05 and fold-change <3/4) in SCH. C, Volcano plot shows altered metabolites between CH and SCH, which increase (red, FDR<0.05 and fold-change >4/3) or decrease (blue, FDR<0.05 and fold-change <3/4) in CH. D, Pathway analysis by Metabolite Set Enrichment Analysis (MSEA), pathway involved in metabolism were included for MSEA, significantly disturbed pathway between SCH and Con (left), CH and Con (right) are shown.

