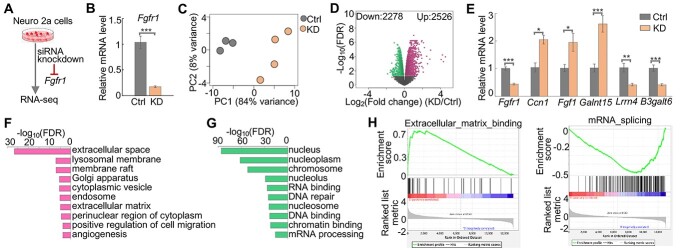
Figure 4.
Fgfr1 knockdown alters the transcriptome. (A) Diagram of the experiment design. (B) qPCR results showing the relative mRNA levels (2-ΔΔCt values) of Fgfr1 in control (Ctrl) and Fgfr1 knockdown (KD) samples. Ctrl, n = 3; KD, n = 5. ***P-value < 0.001, one-tailed t-test. (C) Principal component (PC) analysis results. (D) Volcano plot showing the fold change and FDR. Red dots represent the 2526 upregulated genes, and green dots represent the 2278 downregulated genes. (E) qPCR results showing the relative mRNA levels (2−ΔΔCt values) of six genes in the independent experiments of Fgfr1 knockdown. Ctrl, n = 2; KD, n = 7. *P-value < 0.05; **P-value < 0.01; ***P-value < 0.001; one-tailed t-test. (F) Gene Ontology pathways enriched by the upregulated genes upon Fgfr1 knockdown. (G) Gene Ontology pathways enriched by the downregulated genes upon Fgfr1 knockdown. (H) GSEA results showing the upregulation of the ECM binding pathway and the downregulation of the mRNA splicing pathway.

