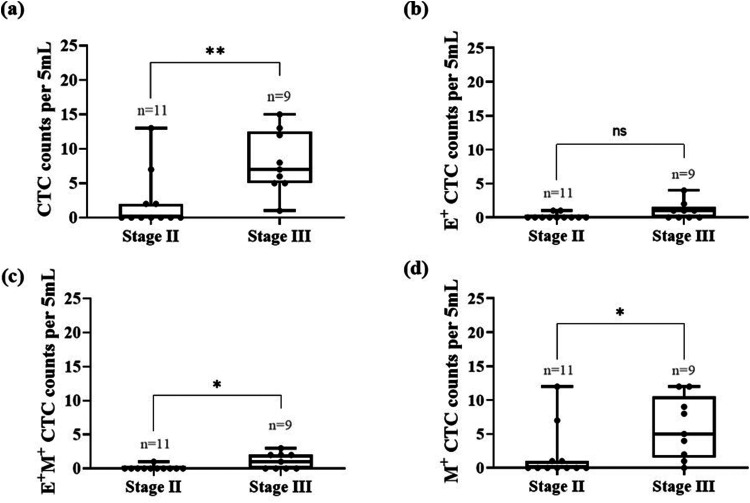
FIG. 4.
Profiling the counts of CTC phenotypes as a function of stage for breast cancer patients prior to treatment. The box plots represent the CTC counts in stage II and stage III patients. The line inside the box represents the median (unpaired Mann–Whitney t-test, *p < 0.05, **p < 0.01, ns = not significant).

