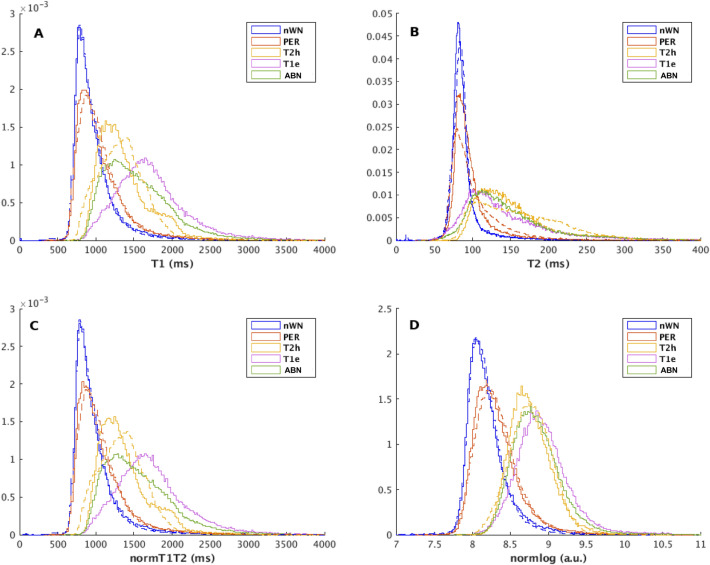
Figure 5.
Probability density functions of the T1 values (a), T2 values (b), the norm of T1 and T2 values –normT1T2- (c), and the norm of the logarithm of T1 and T2 values –normlog- (d) for all the patients showing T1w-enhancement (solid line) and for all the patients without T1w-enhancement (dashed line) for each region of interest (ROI) (Blue→normal white matter -nWM-, Red→perilesional area –PER-, Yellow→T2w-hyperintensity -T2h-, Purple→T1w-enhancement -T1e-, Green—> Abnormal tissue.

