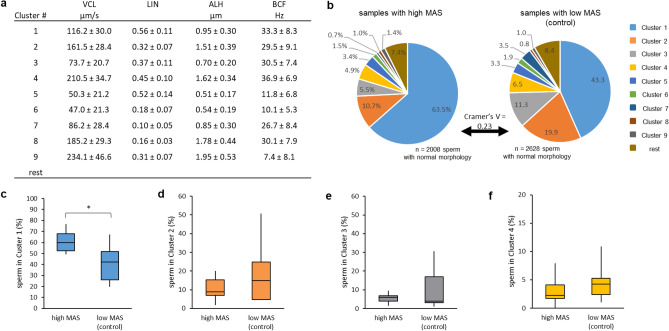
Figure 1.
Distribution of morphologically normal spermatozoa originating from extended semen samples with either enhanced (≥ 15% = high MAS; n = 10 boars) or low (< 5% = low MAS; n = 9 boars) prevalence of cytoplasmic droplets and/or bent tails. Data are based on sperm tracks analysed after a 30-min incubation period at 38 °C in Beltsville Thawing Solution. (a) Motility descriptors (mean ± SD) are given for each cluster. b) Distribution of spermatozoa to the individual cluster based on their origin from high MAS samples or low MAS samples. Cramer’s V indicates a small effect of the sample on sperm distribution. (c)–(e) Comparison of sperm distribution in high MAS samples (n = 10 boars) and low MAS samples (n = 9 boars) for Cluster 1 (c), Cluster 2 (d), Cluster 3 (e) and Cluster 4 (f). Boxes show the interquartile range. Vertical lines indicate minimum and maximum, while the horizontal line in the box indicates the median. An asterisk (*) indicates a significant difference between samples (P < 0.05).

