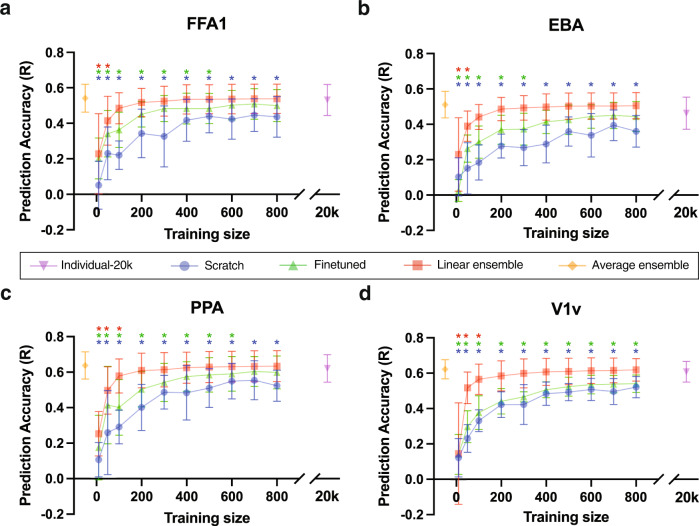
Fig. 2. Encoding model accuracies for FFA1, EBA, PPA and V1v regions, by the size of the training dataset (x-axis).
a–d Boxplots indicate encoding model test accuracy across 8 NSD subjects for the scratch (blue), finetuned (green) and linear ensemble (red) models as training size increases from 10 to 800 image-response pairs. Individual-20K model accuracy is illustrated via the purple boxplot (training size of 20K) and the average ensemble model accuracy is illustrated via the orange boxplot (training size of 0). Asterisks, colored according to the model in question, indicate a significant difference (Wilcoxon tests, p < 0.05) in those models from the gold-standard individual-20K models.

