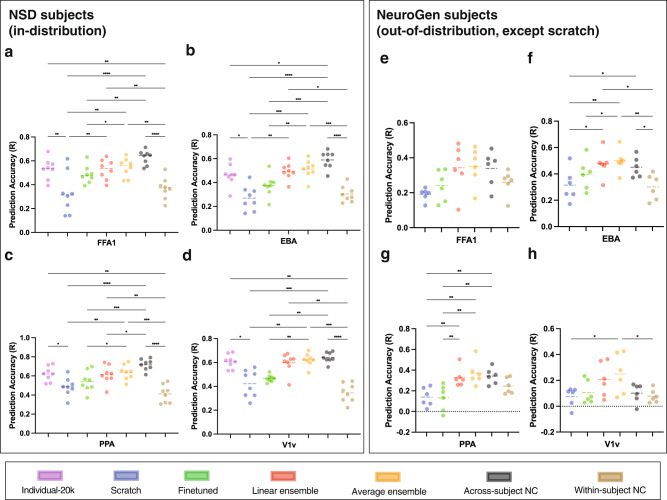
Fig. 3. Encoding model prediction accuracies.
Accuracies for the 8 NSD individuals a FFA1, b EBA, c PPA, d V1v, and 6 NeuroGen subjects e FFA1, f EBA, g PPA, h V1v, measured via Pearson’s correlation between predicted and observed regional activity across a set of test images for 4 regions - FFA1, EBA, PPA and V1v. Individual-20K models are illustrated in purple, scratch models in blue, finetuned in green, linear ensemble in orange and average ensemble in yellow. Scratch, finetuned and linear ensemble models were trained with a dataset of 300 image-response pairs from the novel subject in question. The across-subject noise ceiling (NC), representing the correlation between the average measured test-set responses of the other subjects with the measured test-set responses of the subject in question, and within-subject NC, representing the correlation of the individual’s measured image responses, are shown in black and brown, respectively. Black bars at the top of the panels indicate significant differences in accuracy across the indicated pairs of models (Friedman’s test with FDR corrected p < 0.05). The correspondence between the number of asterisks and the p-value: * - p ≤ 0.05, ** - p ≤ 0.01, ***- p ≤ 0.001, **** -p ≤ 0.0001.

