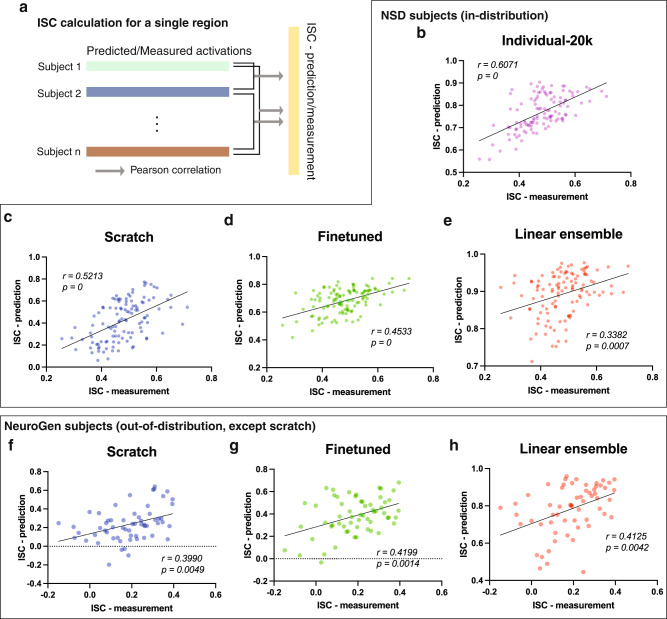
Fig. 4. Preservation of inter-individual differences within the encoding models.
a Inter-subject correlations (ISC) are computed as the Pearson correlation between every pair of subjects’ predicted (ISC-prediction) or measured (ISC-measurement) brain responses, calculated for each of four brain regions separately. The scatter plots show prediction consistency, which is the relationship between the ISC-measurement and ISC-prediction values across every pair of subjects for the images in the test set; the same region’s measured/predicted activity is used for both subjects. The number of points in each scatter plot are therefore the number of brain regions (4) * number of pairs of individuals (for NSD this is (7 × 8)/2 = 23 and for NeuroGen this is (6 × 5)/2 = 15). The scratch, finetuned, and linear ensemble models here were created using a training dataset of 300 image-response pairs for NSD subjects. b–e represent the NSD subjects while f–h represent the NeuroGen subjects. Individual-20K models are not available for the NeuroGen individuals. The predicted responses have better SNR than the measured responses (due to the noise in the fMRI responses that is smoothed in the encoding models), thus note the x and y-axis ranges are quite different. All p values (calculated via permutation testing) are one-tailed and Bonferroni corrected for multiple comparisons.

