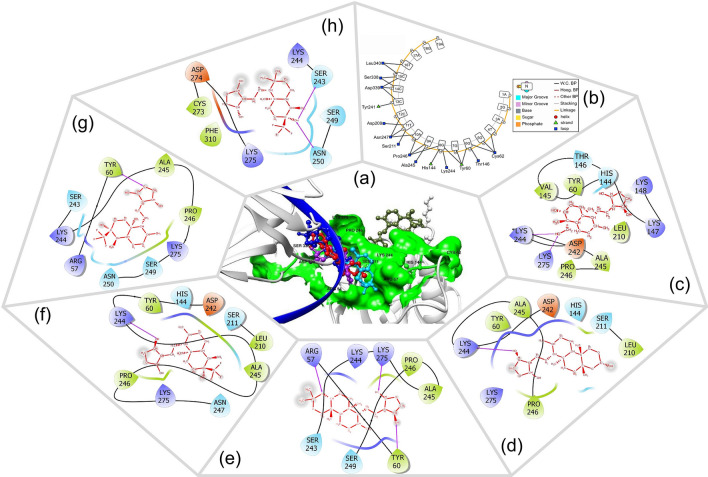
Fig. 1.
a 3D spatial orientation of AGP, selected analogs, and DNA in the substrate binding site of NF-κB p50 after docking. Color code: light grey = protein, green surface = binding pocket, dark blue = ssDNA helix, ball and stick representation = AGP/analogs. b The 2D interactive plot of DNA-NF-κB p50 docking. c–h Pictorial representation of 2D interaction of AGP and Ana1–5, respectively; Residue color red = acidic amino acid, green = hydrophobic amino acids, purple = basic amino acid, blue = polar amino acid; Hydrogen bonds = dashed pink lines, SASA = gray atom background.

