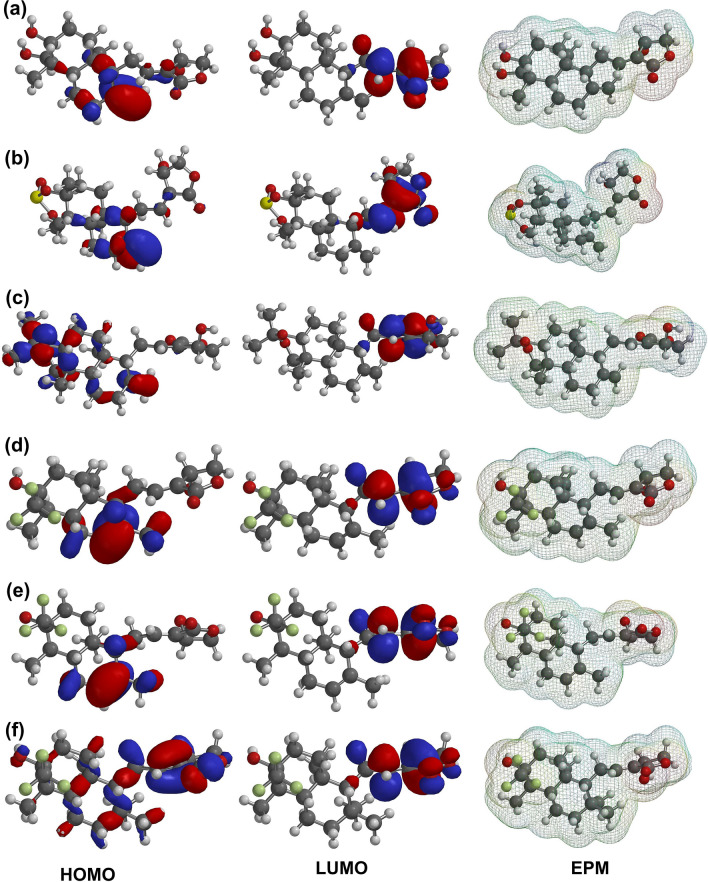
Fig. 3.
Depiction of Frontier orbital energies (HOMO, and LUMO) and Electrostatic Potential Map (EPM) on the surface of AGP and selected analogs; a AGP, b Ana1, c Ana2, d Ana3, e Ana4, f Ana5. Color code: Blue = Most positive potential; Red = Most negative potential; Order of Potential = Red (most − ve) < Orange < Yellow < Green < Blue (most + ve)

