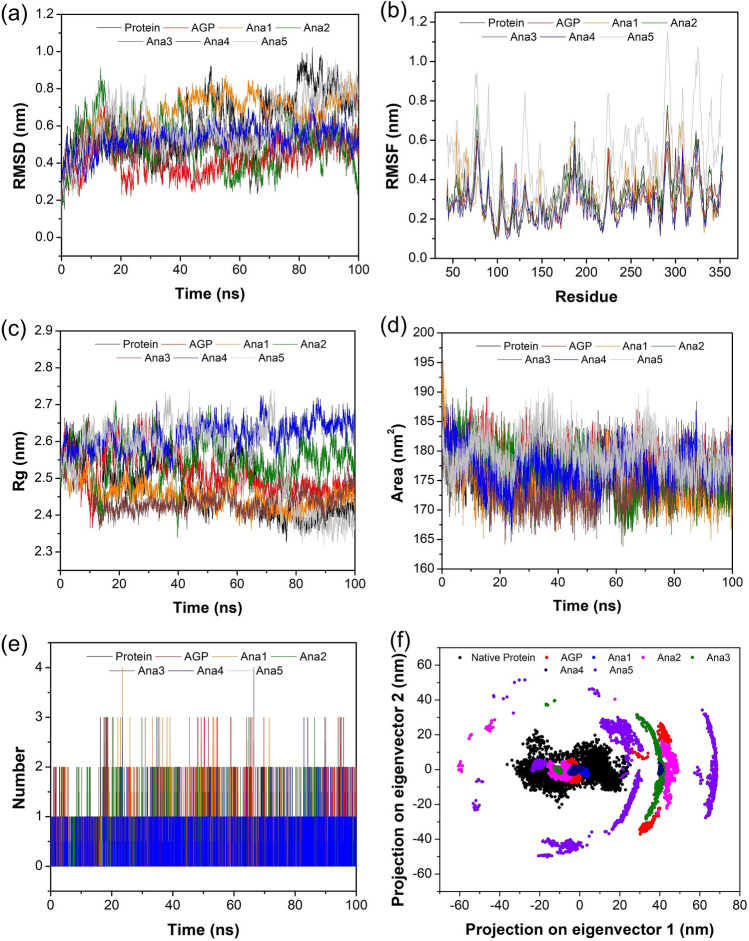
Fig. 4.
Graphical depiction of MD simulation studies of native NF-κB p50 Protein, AGP/selected analogs-native NF-κB p50 complex for 100 ns. a RMSD of backbone, b RMSF profiling, c Rg curve, d SASA graph, e number of H-bonds in AGP/Ana1-5—NF-κB p50 protein complex, and f depiction of Cα motion in term of PC1 and PC2

