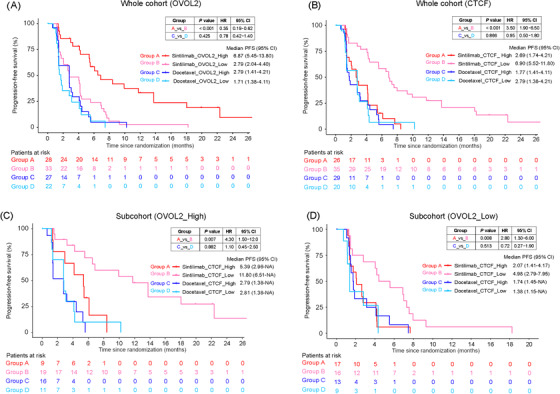
FIGURE 6.

Correlation between PFS and OVOL2 or CTCF. (A) Correlation between PFS and OVOL2 expression level in the BEP. (B) Correlation between PFS and CTCF expression level in the BEP. (C) Correlation between PFS and CTCF expression level in the sub‐cohort of BEP with high OVOL2 expression level. (D) Correlation between PFS and CTCF expression level in the sub‐cohort of BEP with low OVOL2 expression level. Samples were split into high (‘_High’) or low (‘_Low’) expression groups by the median value of the BEP (whole cohort) of the respective gene.
Abbreviation: PFS, Progression‐free survival; HR, Hazard ratio; CI, Confidential interval; OVOL2, ovo‐like zinc finger 2; CTCF, CCCTC‐binding factor; BEP, biomarker evaluable population; NA, not available.
