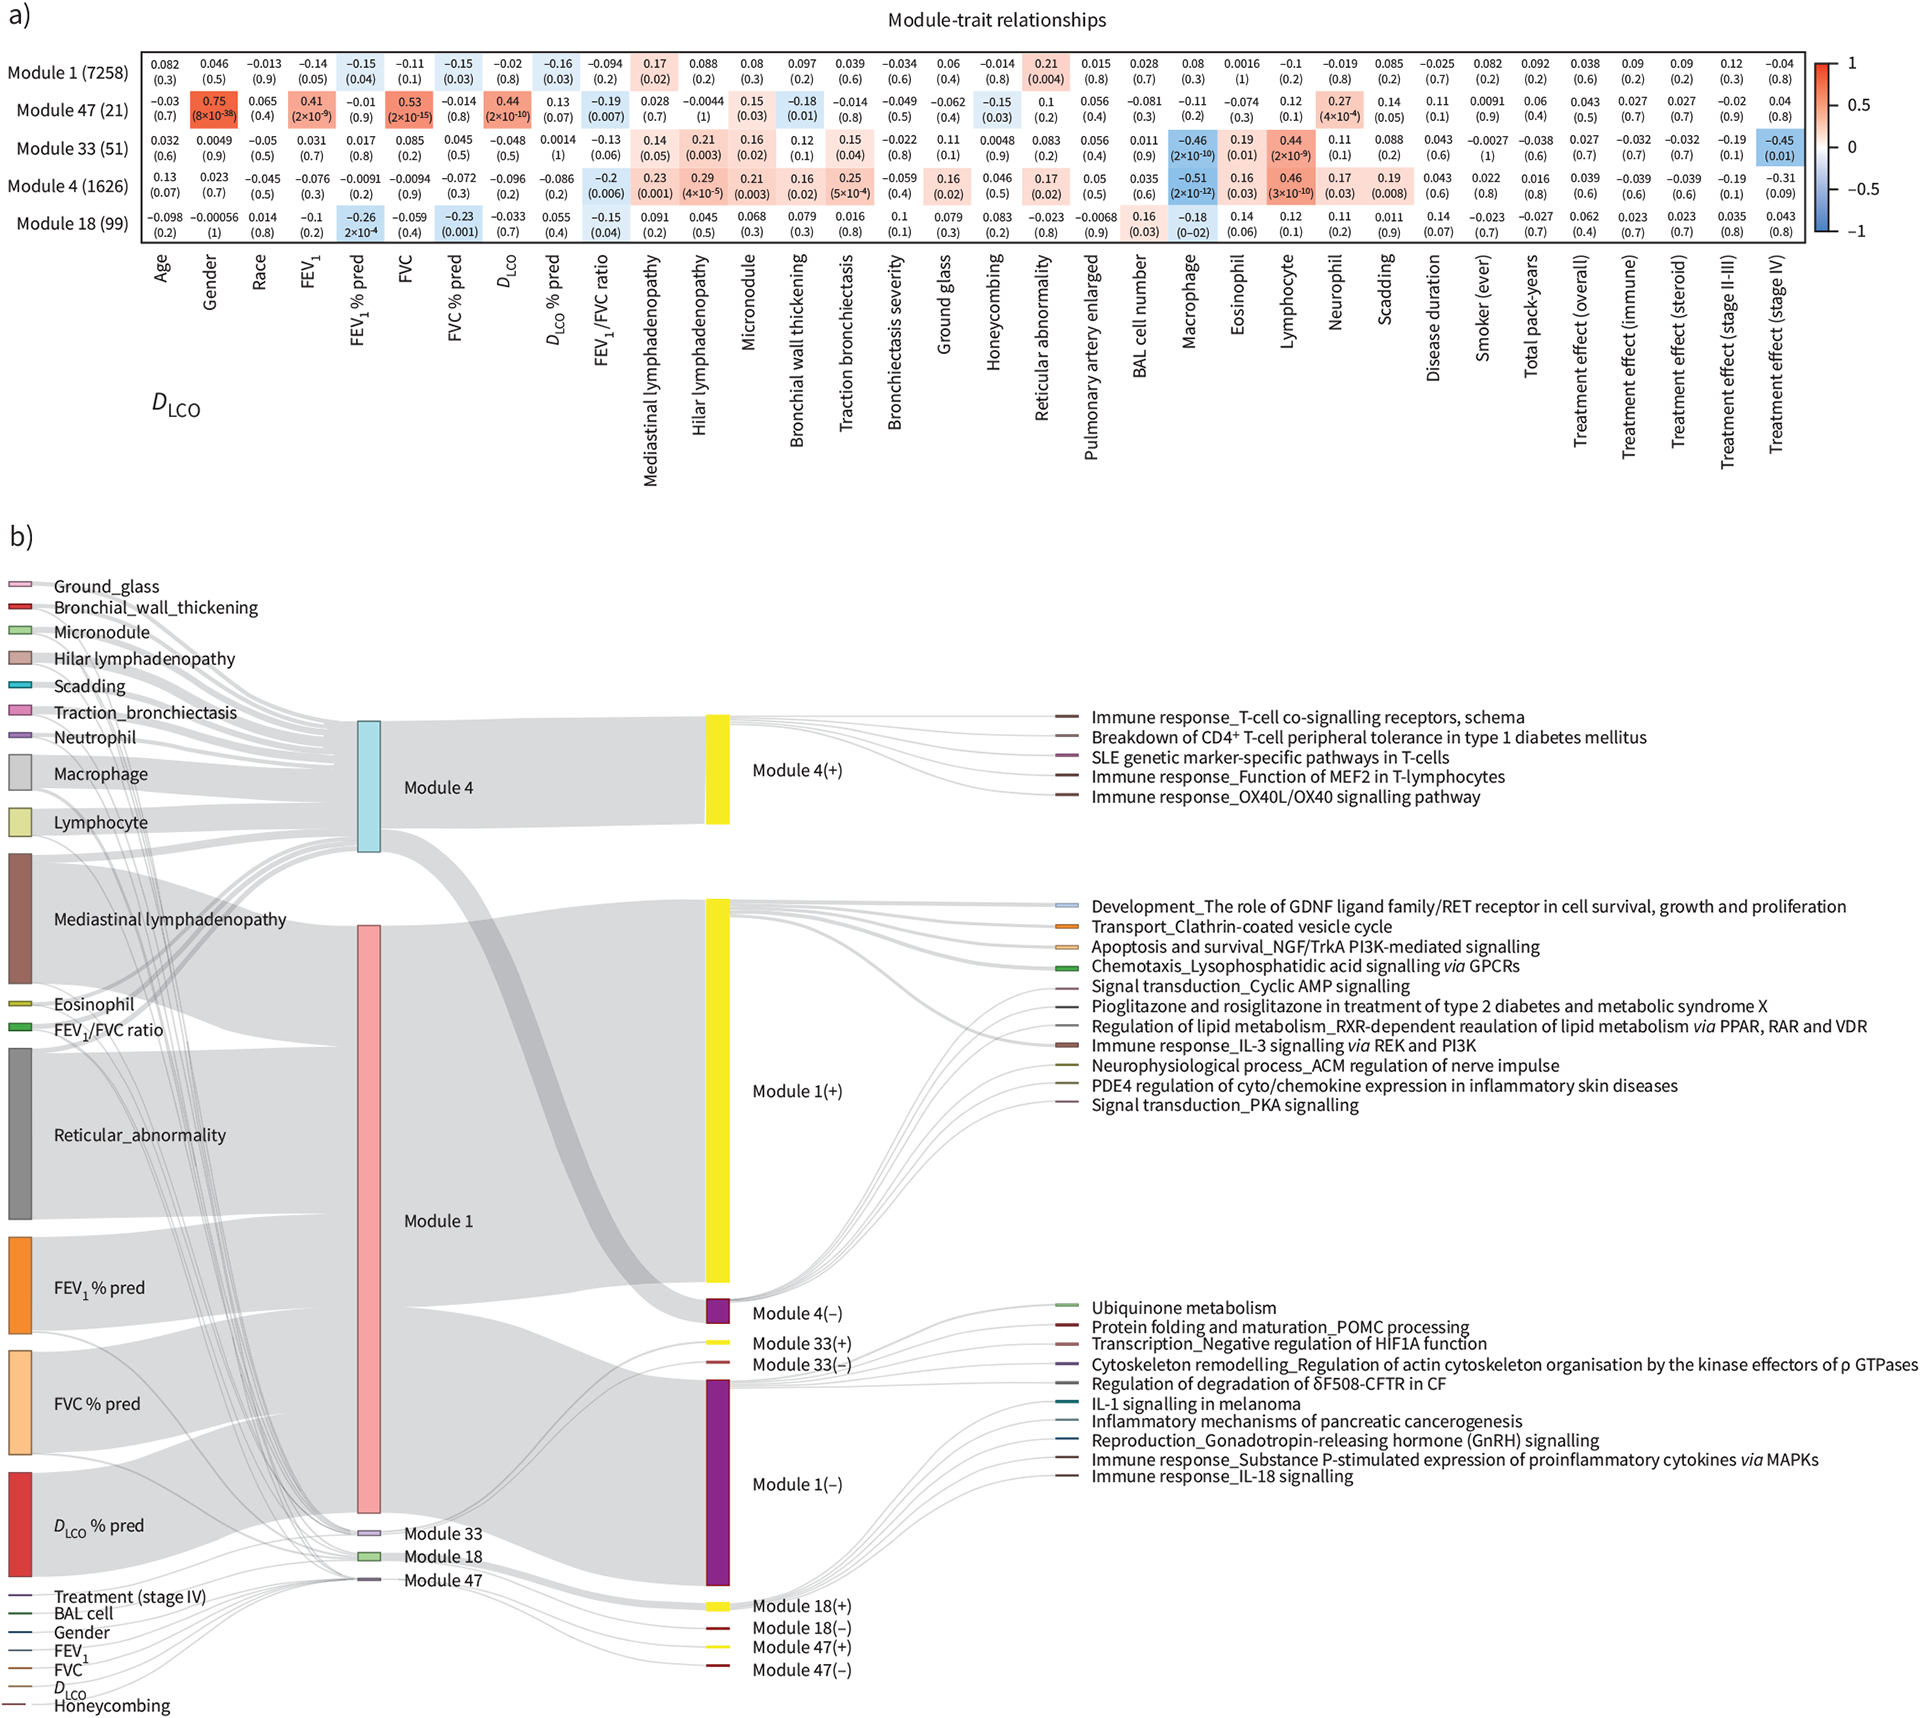
FIGURE 3.

Idenification of gene modules that associate significantly with clinical traits and bronchoalveolar lavage (BAL) cell differentials using weighted gene co-expression network analysis. a) Heatmap showing the correlation (positive in red and negative in blue) between the Eigen genes of five chosen gene modules (1, 47, 4, 33, 18) and clinical traits (demographics, pulmonary function tests, computed tomography scan features, BAL cell differentials, Scadding stage and treatment within stage II–III and IV). b) Sankey plot visualising the significantly correlated clinical traits as well as the top five significantly enriched pathways (with at least three genes) for each gene module and their overlap. Bars on the left represent clinical traits and are connected to gene modules with which they are significantly correlated (p<0.05 in panel a). Bars in the middle represent the five chosen gene modules with bar heights describing module size. Each gene module was split into genes positively and negatively correlated with its eigen gene represented by yellow (+) and purple (−) bars, respectively. Finally, each gene set was connected to its top five significnatly enriched pathways represented by bars on the right, similarly with bar heights describing the number of module member genes from each pathway. Details of the gene modules can be found at https://yale-p2med.github.io/SARC_BAL. FEV1: forced expiratory volume in 1 s; FVC: forced vital capacity; DLCO: diffusing capacity of the lung for carbon monoxide.
