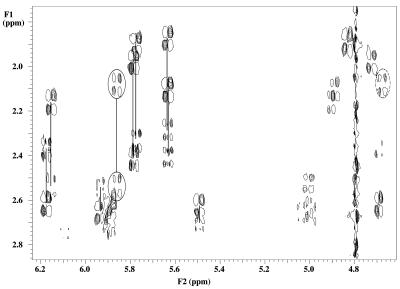
Figure 3.
Expansion of the DQF-COSY spectrum at 20°C showing the H2′ and H2″ to H1′ and H3′ crosspeaks in deoxyribose sugars of the studied duplex. the resolved H2′ and H2″ to H1′ crosspeaks from each sugar ring are connected with lines. Cross signals from residue T7 are encircled with solid and dotted lines for H1′ and H3′, respectively.

