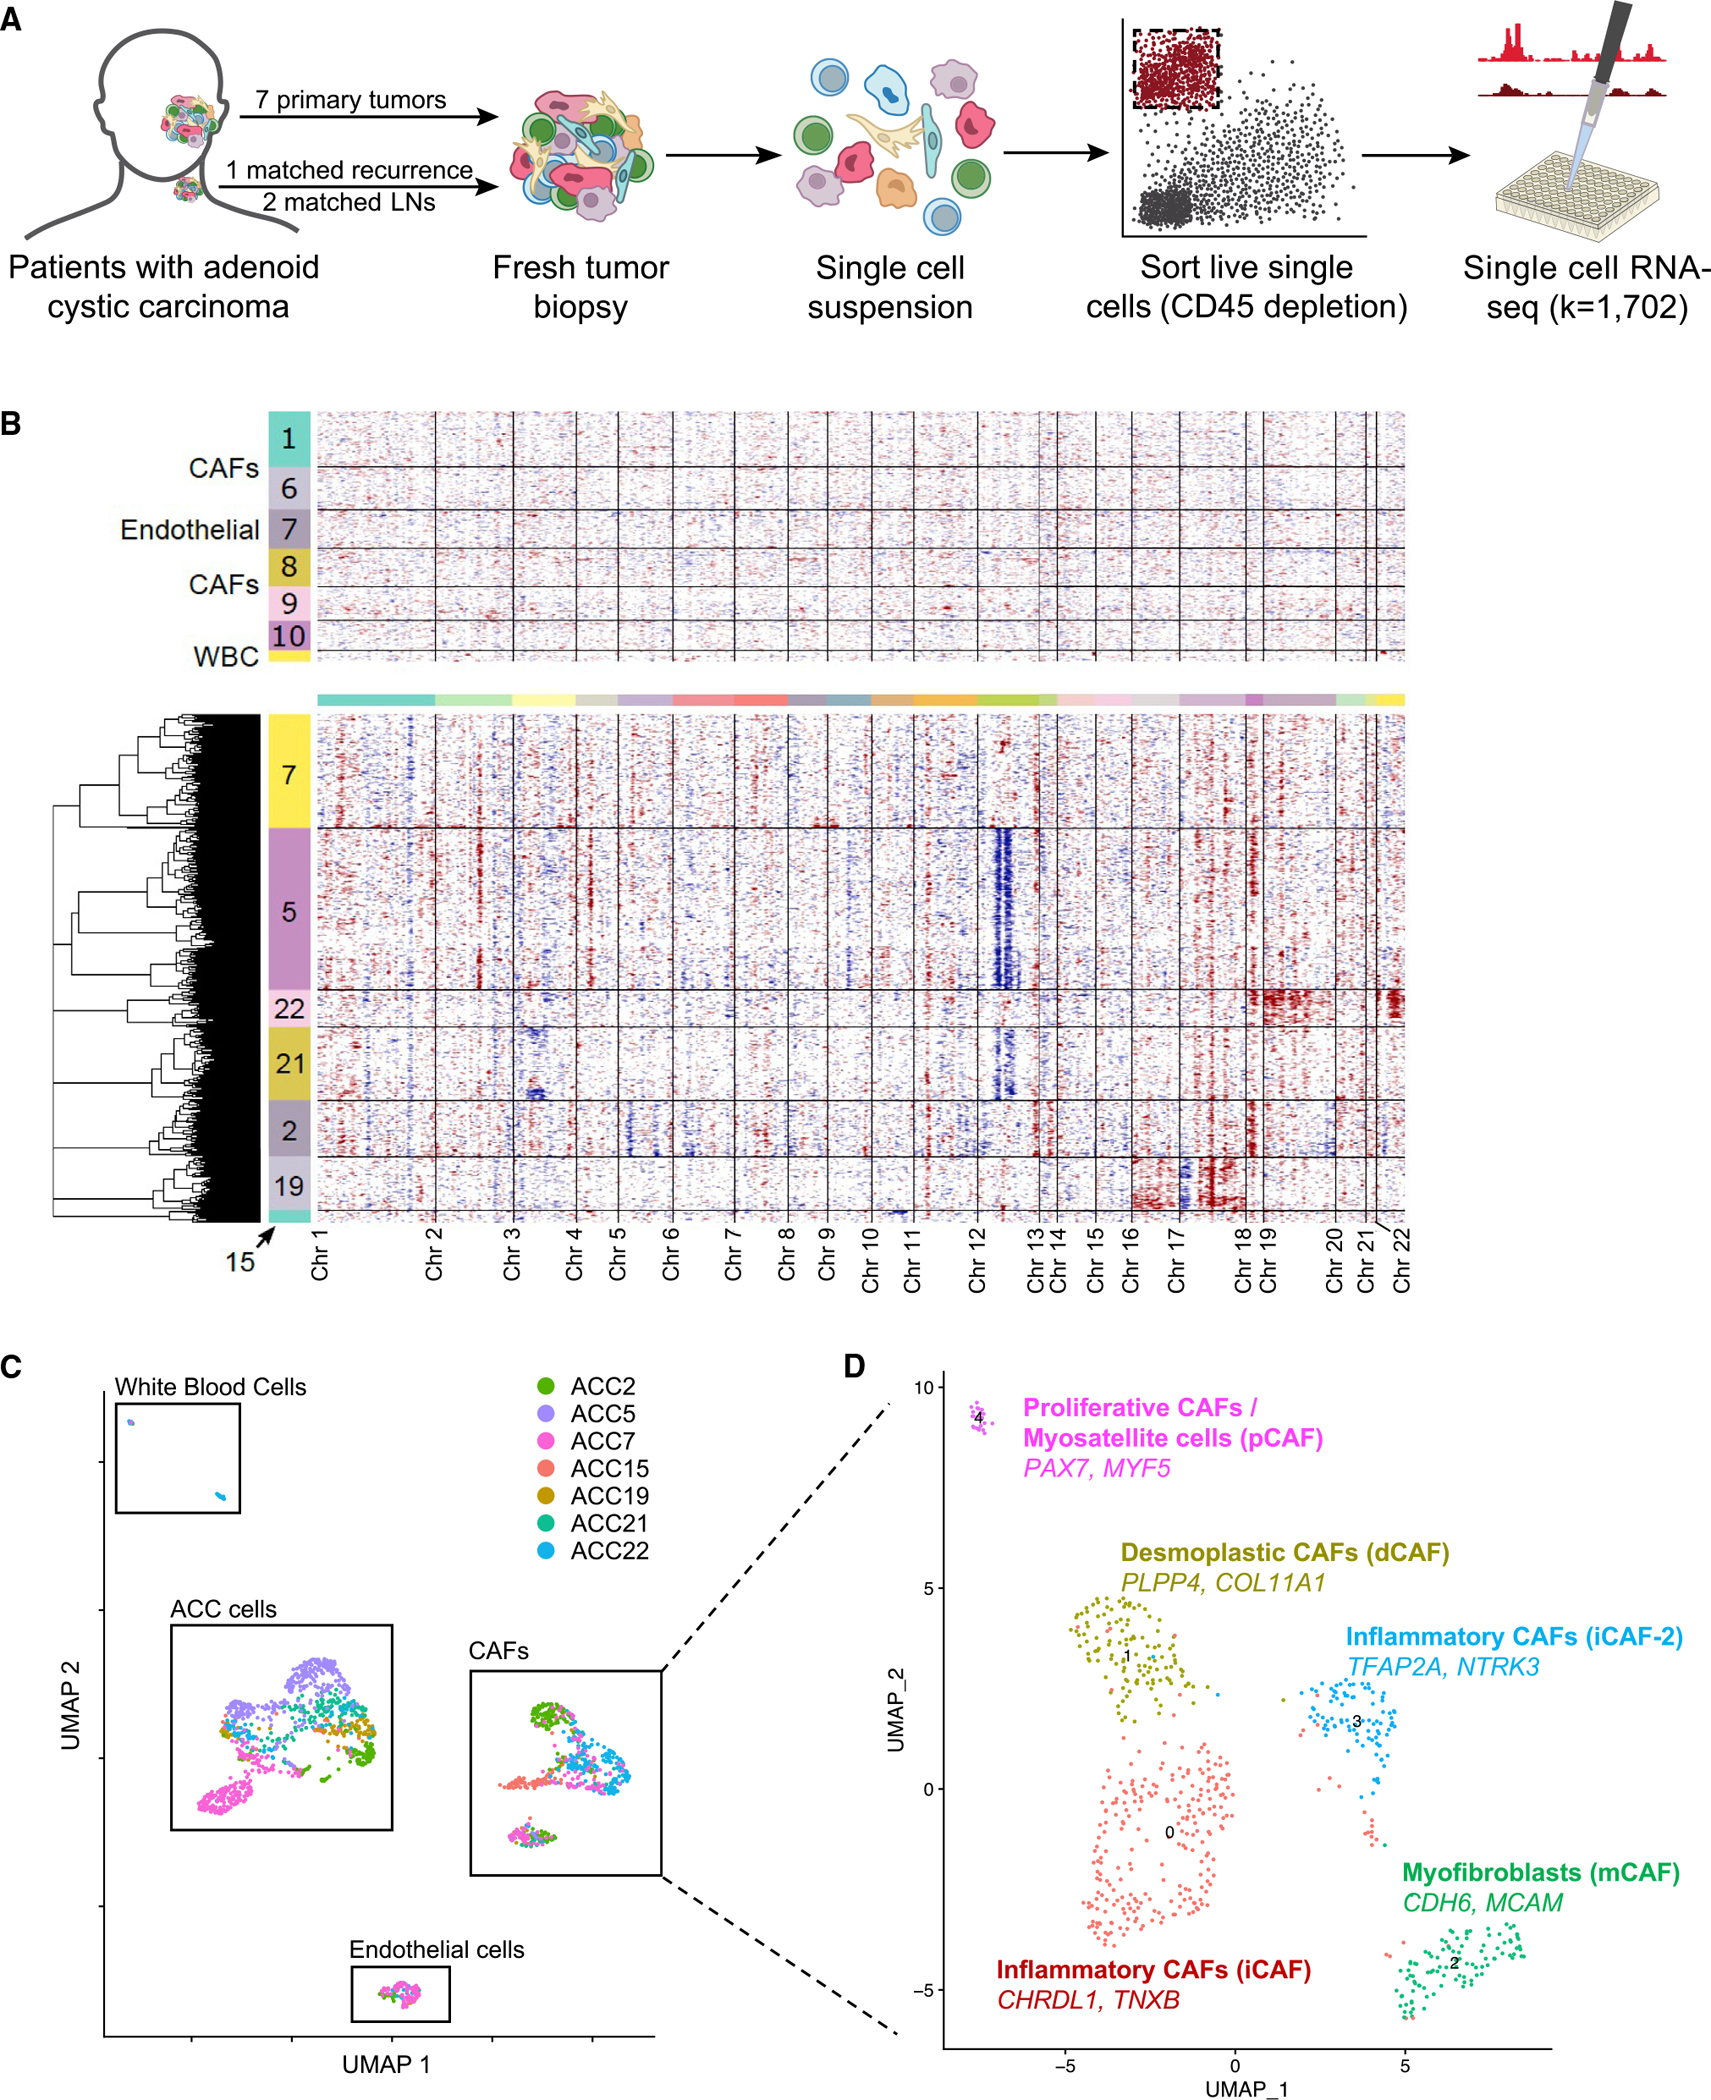
Figure 1. Single-cell RNA sequencing (scRNA-seq) reveals expression heterogeneity in adenoid cystic carcinoma.

(A) Schematic shows scRNA-seq workflow. Freshly resected tumors were dissociated to single-cell suspensions and fluorescence-activated cell sorted (FACS) into 96-well plates after CD45 depletion. Library prep and sequencing were performed per the SMART-Seq2 protocol.
(B) Heatmap of inferred CNAs across all cells, as predicted by inferCNV, separates malignant cells from non-malignant cells. Each row represents a cell, and each column represents a genomic locus. Non-malignant cells are displayed in the top panel, with numbers in the color bar representing cluster number corresponding to Figure S1A. Malignant cells are shown in the bottom panel, with numbers in the color bar corresponding to the patient from whom the cells were obtained.
(C) Uniform manifold approximation and projection (UMAP) of all cells that passed quality control (QC) filtering shows distinct clusters of cancer cells, cancer-associated fibroblasts, endothelial cells, and white blood cells. Cells are colored by patient sample.
(D) UMAP of all cancer-associated fibroblasts (CAFs) that passed QC filtering, annotated by the two most differentially upregulated genes and by previously reported pan-cancer CAF subtypes,10 shows five putative subtypes of CAFs present across ACC tumors.
