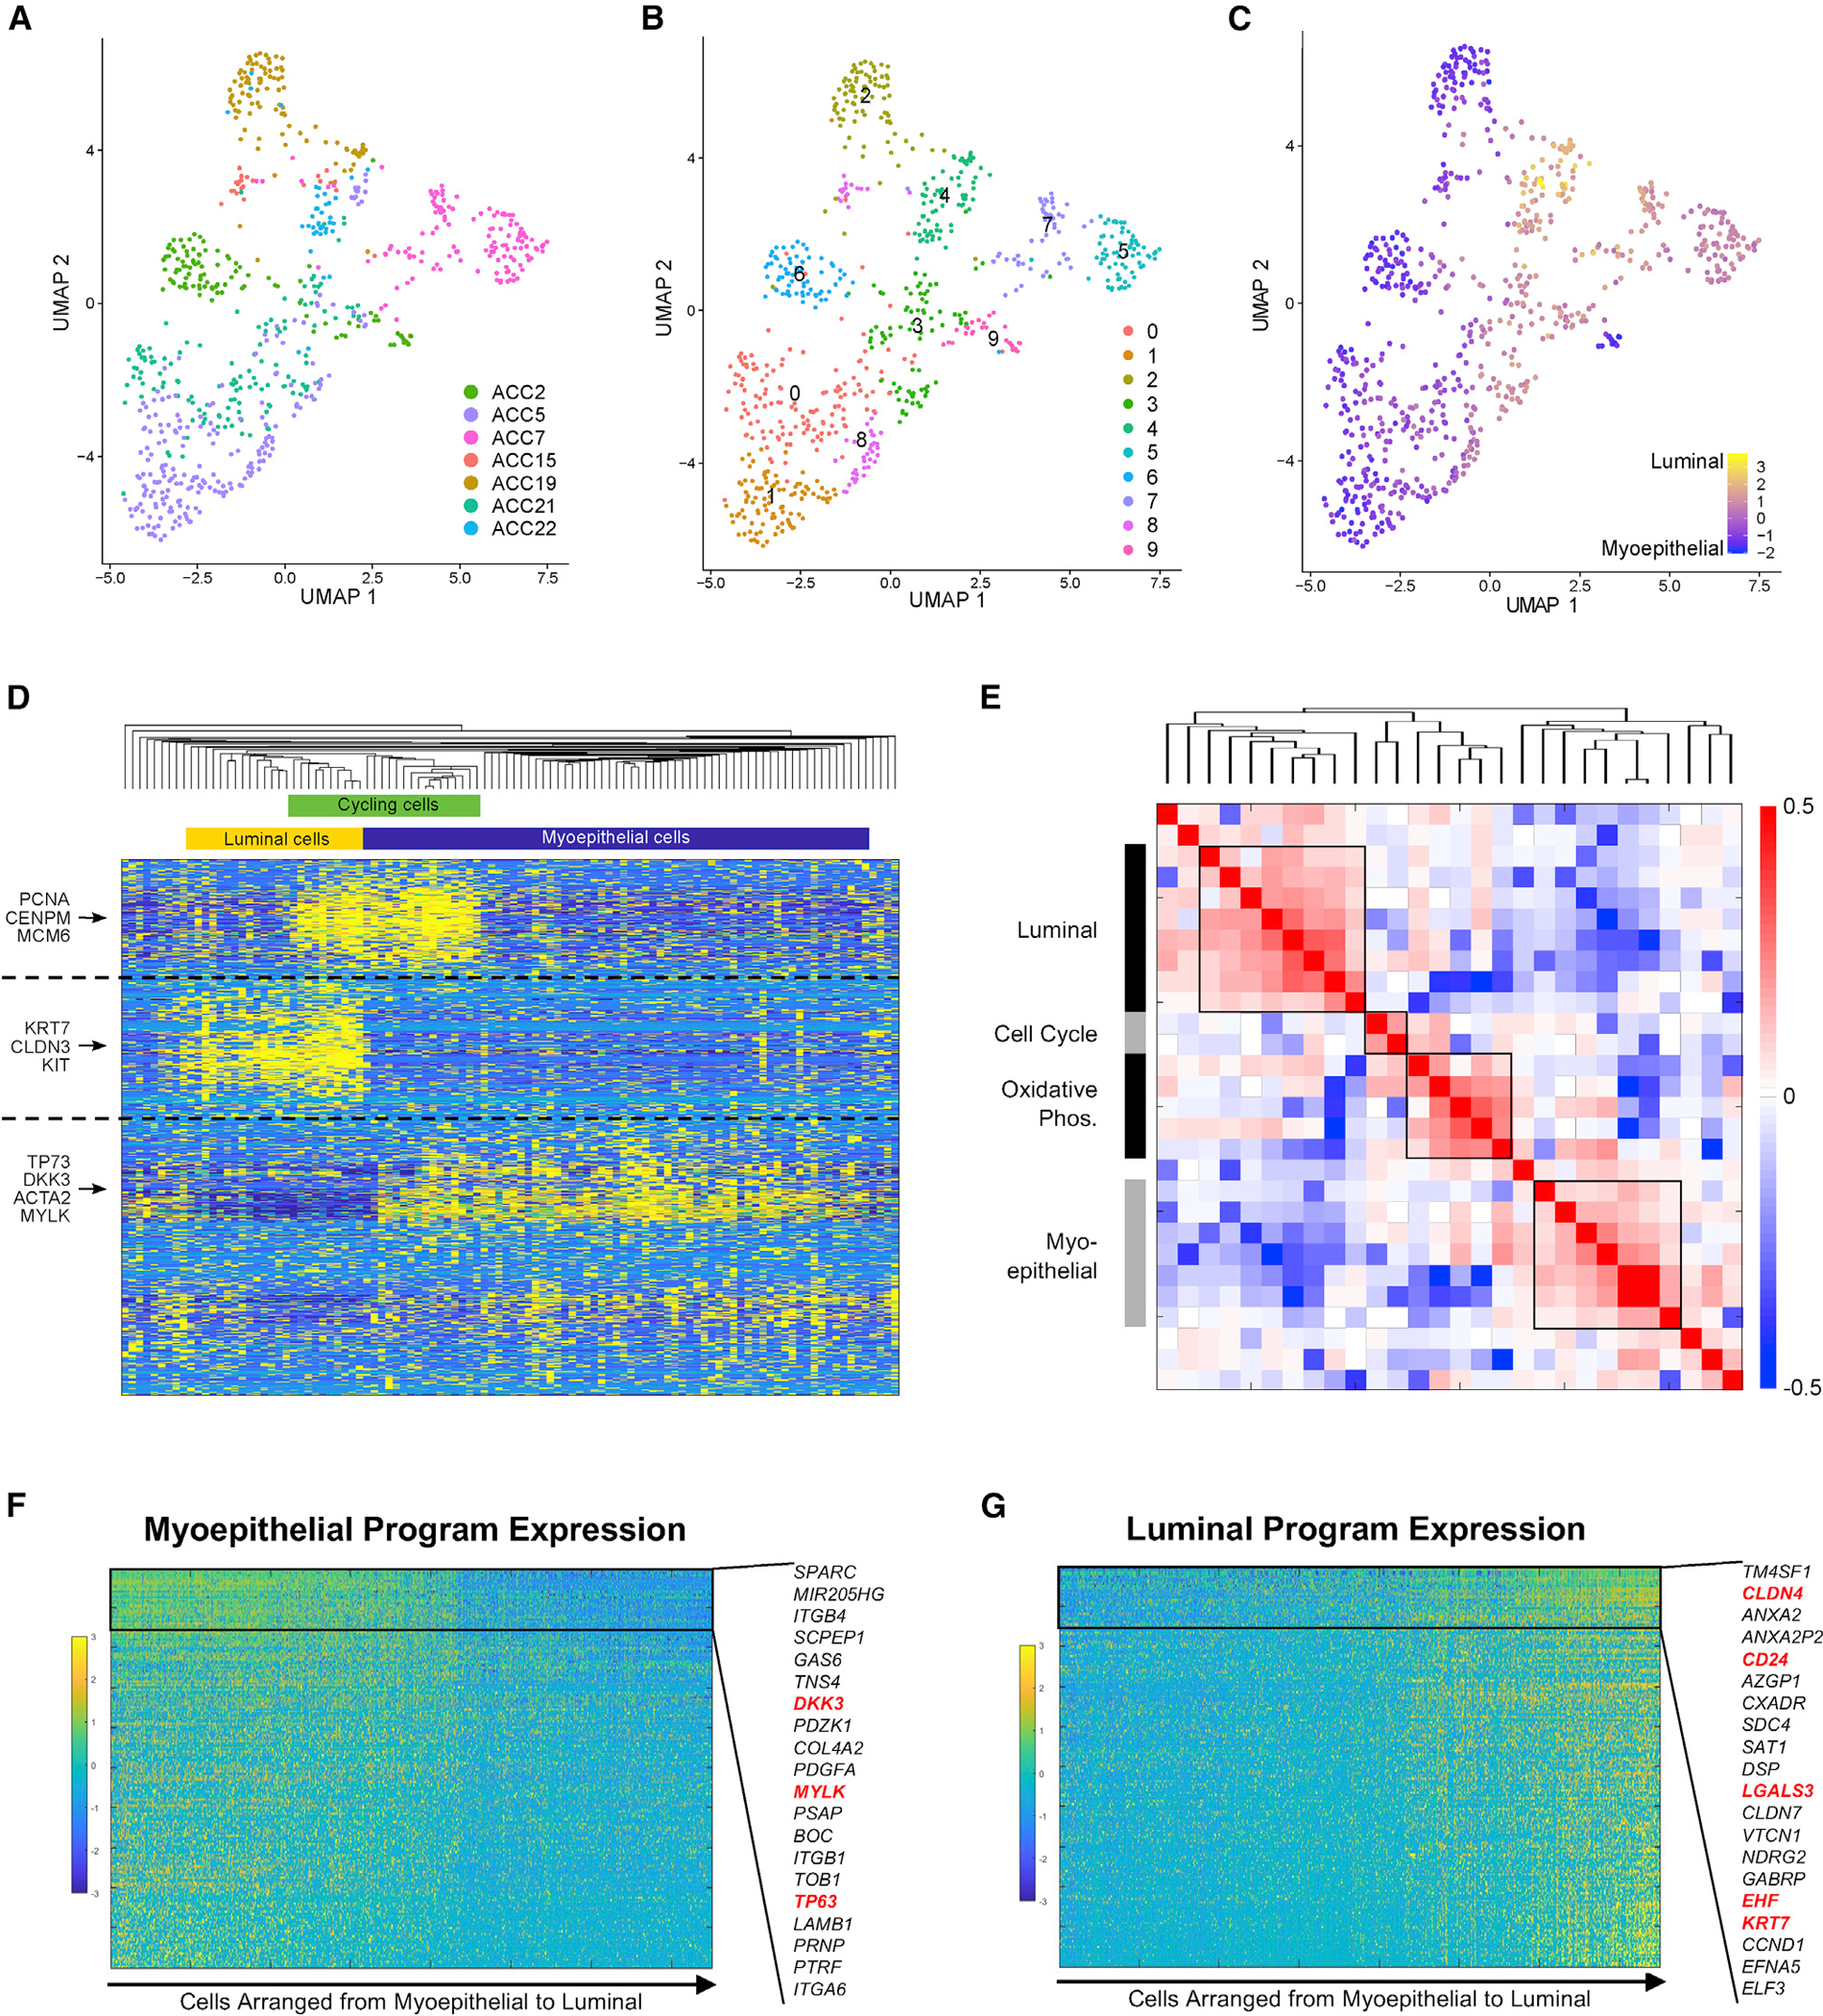
Figure 2. Heterogeneity of the malignant compartment defines in vivo myoepithelial and luminal programs in ACC.

(A) UMAP shows malignant cells from primary tumors with cells colored by patient sample, demonstrating that inter-tumoral heterogeneity is prominent.
(B) UMAP shows 10 clusters identified by unsupervised Louvain clustering using the same UMAP coordinates as (A).
(C) UMAP shows all malignant cells from primary tumors colored on a gradient from myoepithelial (blue) to luminal (yellow), based on marker expression, using the same UMAP coordinates as (A) and (B). Luminal cells cluster together regardless of patient of origin.
(D) Heatmap shows expression of the top 200 genes in each of the four NMF programs detected in an individual representative sample, ACC2. Key genes are annotated on the left, and inferred cell identity is shown on the top. Cells (columns) and genes (rows) are clustered by hierarchical clustering according to Pearson correlation. Myoepithelial, luminal, and cell-cycle programs are detected by unsupervised NMF analysis of a single tumor.
(E) Heatmap shows Spearman correlations between each NMF metagene from each patient, clustered by hierarchical clustering. This metaclustering analysis shows consistent luminal, cell-cycle, oxidative phosphorylation, and myoepithelial programs across tumors.
(F) Gene-expression heatmap shows expression of top 200 genes in the myoepithelial NMF program in malignant cells. Genes (rows) are sorted by variation across myoepithelial cells, and cells (columns) are sorted from myoepithelial to luminal according to myoepithelial and luminal marker scores. The 20 least variable genes are highlighted, and previously described myoepithelial markers are shown in red.
(G) Gene-expression heatmap shows expression of top 200 genes in the luminal NMF program in malignant cells. Genes (rows) are sorted by variation across luminal cells, and cells (columns) are sorted from myoepithelial to luminal. The 20 least-variable genes are highlighted, and previously described luminal markers are shown in red.
