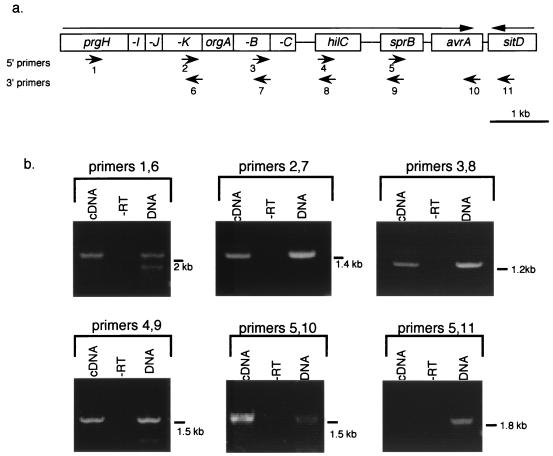
FIG. 3.
RT-PCR analysis of the prg operon. (a) Genetic organization of the prg, org, and downstream genes. Location of 5′ and 3′ primers used in RT-PCR are indicated by numbered arrows below the map. Arrows above the map indicate the direction of transcription of each gene. (b) Results of RT-PCR amplification assays. Primers used in each reaction are listed above the bracket. Three reaction conditions were run for each primer pair. cDNA was amplified from serovar Typhimurium SL1344 whole-cell RNA by using the 3′ primer and PCR amplified with the same 3′ primer and the indicated 5′ primer (cDNA lanes). As a control that DNA was not the amplification template, each RT-PCR was run without the addition of RT (-RT lanes). Amplification of each band from SL1344 genomic DNA demonstrates the size of the expected band for each reaction. (DNA lanes). The size of each band is indicated.

