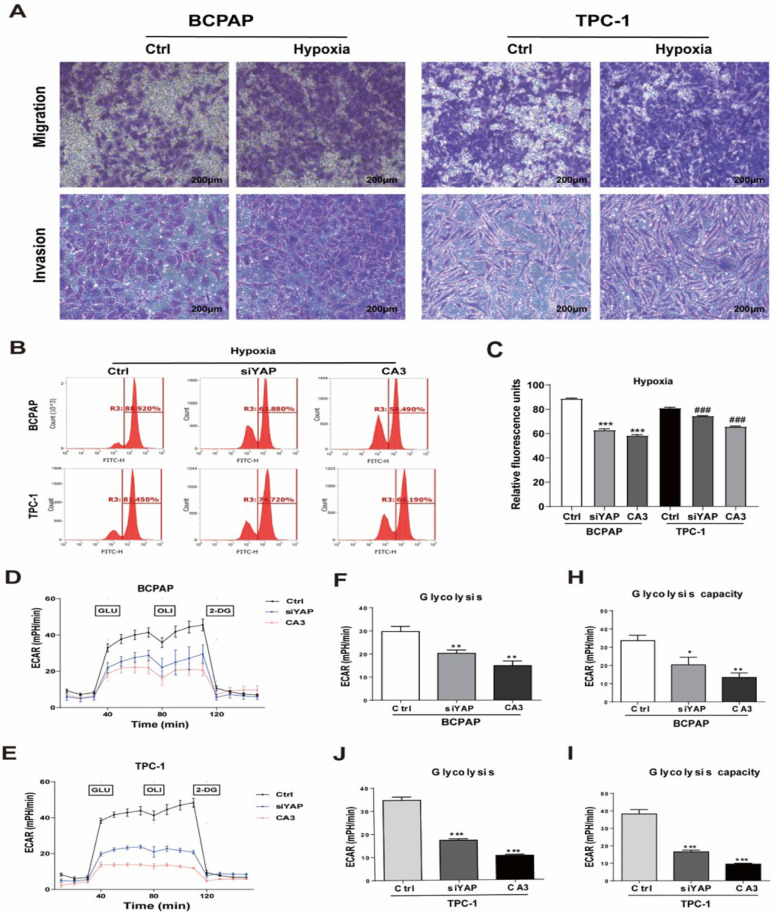
Figure 3.
Genetic (silencing YAP) or pharmacologic (CA3) inhibition of YAP inhibited PTC cell glycolysis under hypoxia. (A) Migration and invasion assays in BCPAP and TPC-1 cells under normoxia (20% O2) or hypoxia (1% O2) for 24h. (magnification, × 100). Data are shown as the mean ± SEM of three independent experiments. *p < 0.05, **p < 0.01, ***p < 0.001. (B-C) Analysis of the uptake of glucose in BCPAP and TPC-1 cells under hypoxia (1%O2) for 24h after transfected with YAP siRNA or the use of the inhibitor CA3. (D-E) The overall glycolytic flux of PTC cells under hypoxia (1%O2) after transfected with YAP siRNA or the use of the inhibitor CA3 were analyzed by ECAR using seahorse instrument. (F-J) Glycolysis after the addition of glucose in BCPAP and TPC-1 cells. (H-I) Glycolysis capacity after the addition of oligomycin in BCPAP and TPC-1 cells.

