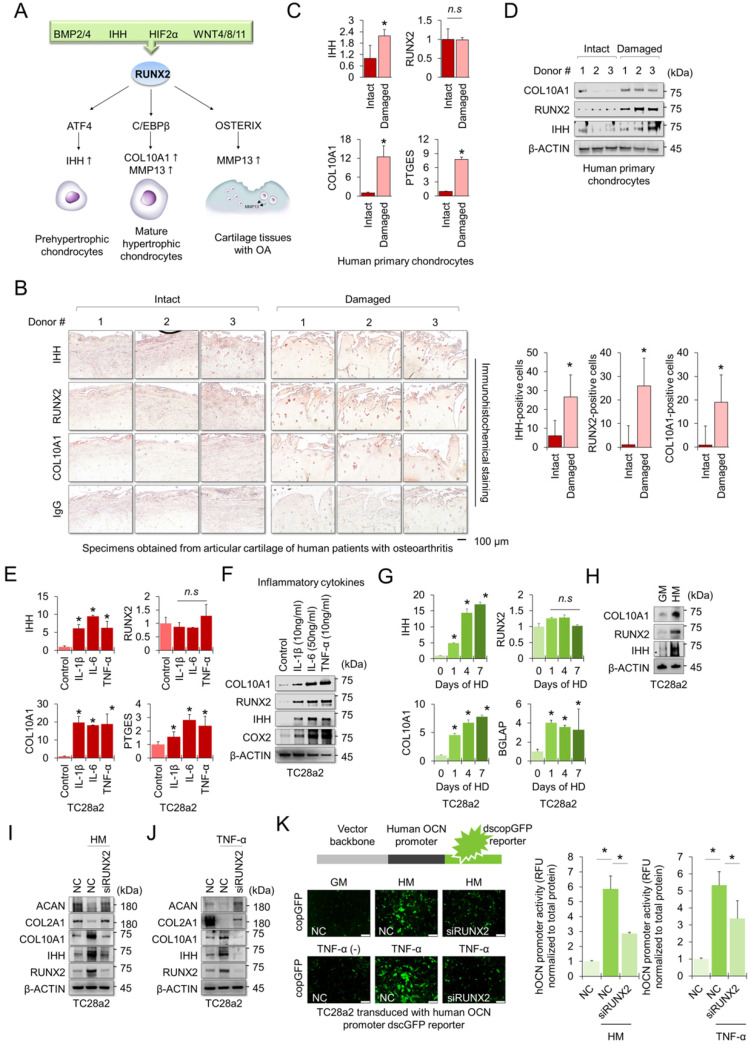
Figure 1.
RUNX2 is a key mediator of chondrocyte hypertrophy. (A) Schematic diagram of the role of RUNX2 in the process of chondrocyte hypertrophy and osteoarthritis (OA). Activation of RUNX2 by various stimuli induces hypertrophy of articular chondrocytes, inducing the expression of downstream genes, thereby accelerating OA progression. (B) Representative images of immunostaining in human cartilage isolated from knee OA patients undergoing total knee replacement. Scale bars, 100 µm for immunostaining. IHH-, RUNX2-, and COL10A1-positive cells were counted from the total cell population per field in immunohistochemical sections. *P < 0.05 in comparison with intact groups (n = 6 experimental replicates). (C) qRT-PCR analysis of IHH, RUNX2, COL10A1, and PTGES mRNA expressions in primary chondrocytes isolated from knee OA patients undergoing total knee replacement. *P < 0.05 in comparison with control group (n = 6 experimental replicates). n.s., not significant. (D) Representative images of western blot analysis for protein levels of IHH, RUNX2, and COL10A1 in primary chondrocytes isolated from knee OA patients undergoing total knee replacement. (E) qRT-PCR analysis of IHH, RUNX2, COL10A1, and PTGES mRNA expression in TC28a2 cells that were treated with or without inflammatory cytokines (10 ng/ml IL-1β, 50 ng/ml IL-6, or 10 ng/ml TNF-α). *P < 0.05 in comparison with control group (n = 3 experimental replicates). n.s., not significant. (F) Representative images of western blot analysis for protein levels of COX2, IHH, RUNX2, and COL10A1 in TC28a2 cells that were treated with or without inflammatory cytokines (10 ng/ml IL-1β, 50 ng/ml IL-6, or 10 ng/ml TNF-α). β-ACTIN was used as a loading control. (G) qRT-PCR analysis of IHH, RUNX2, COL10A1, and BGLAP mRNA expression in TC28a2 cells that were treated with or without hypertrophic medium. *P < 0.05 in comparison with control group (n = 3 experimental replicates). (H) Representative images of western blot analysis for protein levels of COX2, IHH, RUNX2, and COL10A1 in TC28a2 cells that were treated with or without hypertrophic medium. β-ACTIN was used as a loading control. GM, growth medium; HM, hypertrophic medium. (I, J) Representative images of western blot analysis for protein levels of RUNX2, IHH, COL10A1, COL2A1, and ACAN in siRNA-transfected TC28a2 cells that were treated with or without hypertrophic medium/TNF-α (10 ng/ml). β-ACTIN was used as a loading control. NC, non-targeting control siRNA; siRUNX2, siRNA targeting RUNX2. (K) Fluorescence images showing the activity of OCN promoter and the OCN promoter reporter quantity. TC28a2 cells were transduced with lentivirus of OCN pGreenZeo differentiation reporter. Bar graph indicates the fluorescence-based activities of OCN promoter. *P < 0.05 compared with the NC group (n = 3 experimental replicates). OCN, osteocalcin; dscopGFP, destabilized form of copepod green fluorescence protein. Scale bars, 100 µm.

