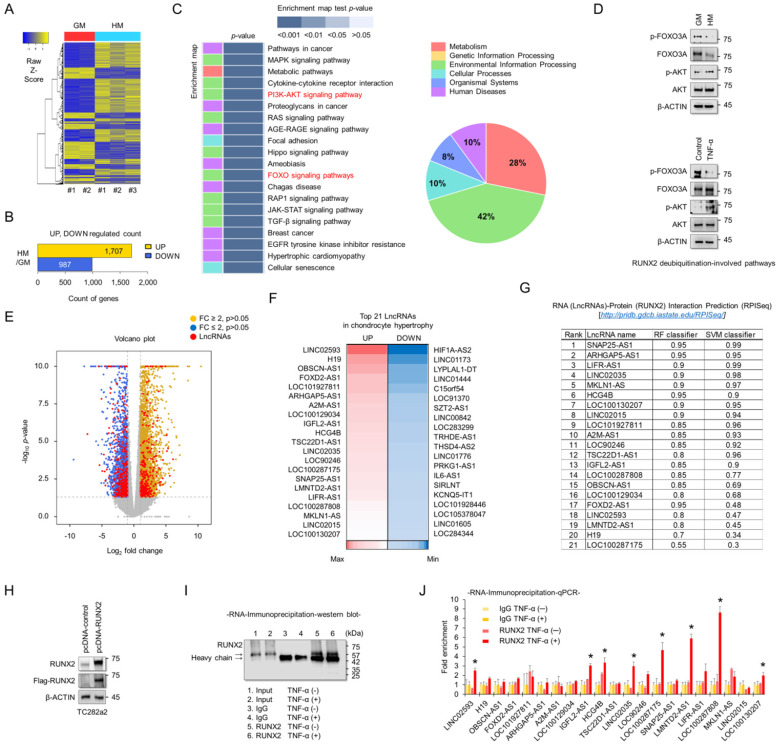
Figure 2.
Screening of lncRNAs exhibiting different expression between normal and hypertrophic chondrocytes, and identification of their potential interactions with RUNX2. (A) Hierarchical clustering of RNA-sequencing data. A heatmap was generated from RNA-sequencing data using RNA extracted from TC28a2 cells grown with growth medium (GM) or hypertrophic medium (HM). The results were compared between GM (n = 2) and HM (n = 3). The relative expression of total mRNAs is depicted according to the color scale shown on the left. Yellow represents relatively high expression and blue means relatively low expression, and -1, 0, 1 are fold changes in the corresponding spectrum. (B) A bar graph shows numbers of up-regulated (yellow) and down-regulated (blue) genes. (C) Kegg pathway annotation categories for target gene functions and a diagram for the related cellular pathways. (D) Representative images of western blot analysis for protein levels of AKT, p-AKT, FOXO3A, and p-FOXO3A in TC28a2 cells that were treated with or without hypertrophic medium/TNF-α. β-ACTIN was used as a loading control. GM, growth medium; HM, hypertrophic medium. (E) Volcano plots of differentially expressed RNAs between GM and HM groups. Red dots indicate differentially expressed lncRNAs between two groups. Volcano plot of all genes expressed greater than 1 count-per-million where the observed log2 fold change is on the x-axis and the unadjusted P value converted to the -log10 scale is on the y-axis. (F) A heatmap of differentially expressed lncRNAs during hypertrophic differentiation of TC28a2 cells. The data shows the top 21 lncRNAs which have shown a distinctively increased expression pattern (Red; > fold change 4) or with the greatest decrease (Blue) in expression levels during hypertrophic differentiation. (G) RPISeq analysis was used to predict the interaction probability of selected lncRNAs with RUNX2. An RF and SVM > 0.5 was considered to have the ability of binding (http://pridb.gdcb.iastate.edu/RPISeq/about.php#basic). (H) Representative images of western blot analysis for protein levels of FLAG and RUNX2 in TC28a2 cells that were transfected with pcDNA-mock or pcDNA-RUNX2-FLAG plasmid vector. β-ACTIN was used as a loading control. (I) A representative image of western blot analysis for protein levels of RUNX2 using RNA-IP samples obtained from TC28a2 cells transfected with pcDNA-RUNX2 vector. RNA-IP was conducted by dividing the TNF-α-treated group and the non-TNF-α group here. (J) The bar graph displays the RNA-IP-qPCR fold enrichment of the indicated lncRNAs relative to the IgG control. RNA-IP was performed in TC28a2 cells transfected with the pcDNA-RUNX2 vector. *P < 0.05 in a comparison with the IgG control (n = 3 experimental replicates).

