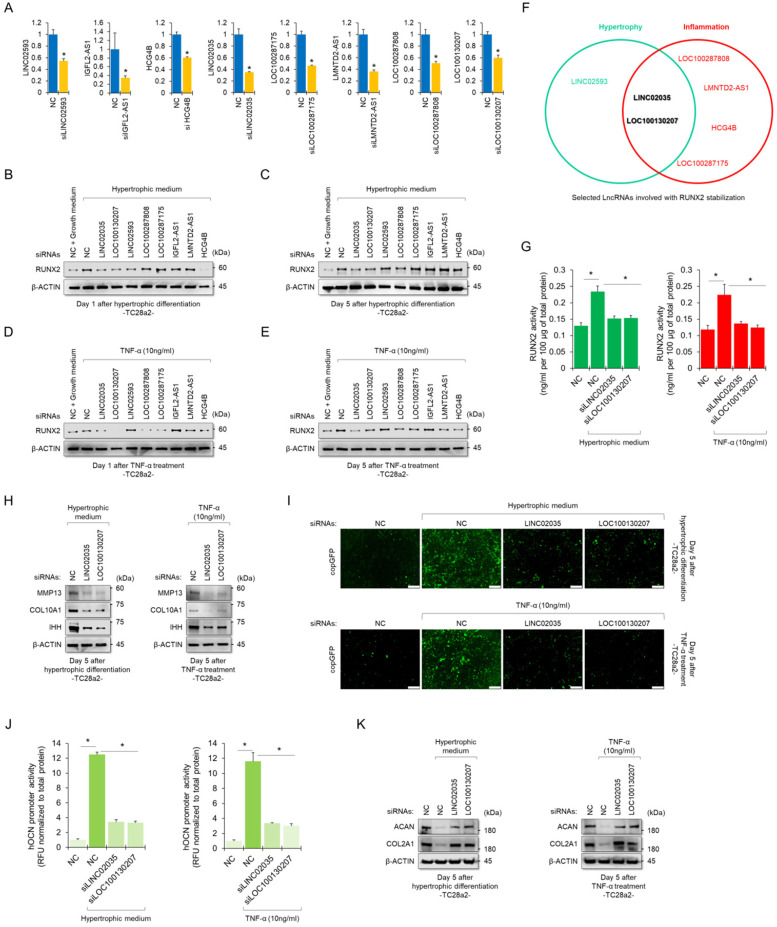
Figure 3.
Upregulation of LINC02035 and LOC100130207 is implicated with hypertrophic changes in normal chondrocytes. (A) qRT-PCR analysis of each lncRNA expression in TC28a2 cells transfected with siRNAs (100 nM) targeting each lncRNA. The qPCR analysis was performed to confirm the efficiency of each siRNA used in this study for lncRNA knockdown. *P < 0.05 in comparison with NC group (n = 3 experimental replicates). NC, non-targeting control siRNA. (B-E) Representative images of western blot analysis for protein levels of RUNX2 in each siRNA-transfected TC28a2 cells that were treated with or without hypertrophic medium/TNF-α (10 ng/ml). β-ACTIN was used as a loading control. Western blot analysis was performed on day 1, which is an early stage of hypertrophic differentiation or inflammatory response, and day 5, which is a late stage, respectively. (F) The diagram shows the intersection of groups that did not change the amount of RUNX2 protein in both the early and late stages despite the hypertrophic medium or TNF-α treatment in TC28a2 cells when each siRNA was transfected. (G) Effects of knockdown of LINC02035 or LOC100130207 on RUNX2 activity were determined by enzyme-linked immuno-sorbent assay (ELISA). Hypertrophic medium or TNF-α was treated in each siRNA-transfected TC28a2 cells, and the cells were lysed in order to obtain total protein. RUNX2 activities were normalized to 100 µg of total protein. *P < 0.05 in comparison with NC group (n = 3 experimental replicates). (H) Representative images of western blot analysis for protein levels of IHH, COL10A1, and MMP13 in siRNA-transfected TC28a2 cells that were treated with or without hypertrophic medium/TNF-α (10 ng/ml). β-ACTIN was used as a loading control. (I) Fluorescence images showing the activity of OCN promoter and the OCN promoter reporter quantity. Lentivirus of OCN pGreenZeo differentiation reporter-transduced TC28a2 cells were transfected with siRNAs targeting LINC02035 or LOC100130207, and the cells were then treated with hypertrophic medium or TNF-α (10 ng/ml). Scale bars, 200 µm. (J) The bar graph indicates the fluorescence-based activities of OCN promoter. *P < 0.05 compared with the NC group (n = 3 experimental replicates). (K) Representative images of western blot analysis for protein levels of COL2A1 and ACAN in siRNA-transfected TC28a2 cells that were treated with or without hypertrophic medium/TNF-α (10 ng/ml). β-ACTIN was used as a loading control.

