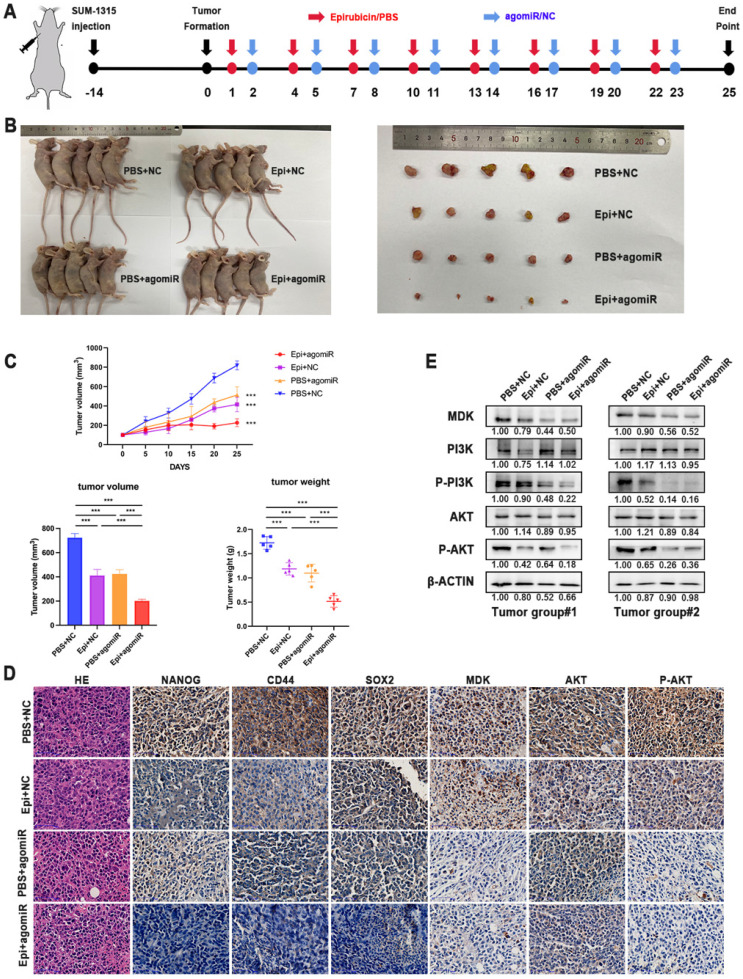
Figure 7.
Overexpression of miR-1275 reduced chemoresistance in in vivo. A. In in vivo experimental design. B. Representative images of mice and tumors at the end point after subcutaneous transplantation when mice were euthanized. C. Tumor growth curves, tumor volume and tumor weight of the respective groups. D. IHC analysis of the expression levels of NANOG, CD44, SOX2, MDK, AKT and P-AKT in the respective groups. The positive staining was indicated by a brown color. E. MDK, PI3K, P-PI3K, AKT and P-AKT expression was measured by western blot in different tumors. ***p < 0.001. Scale bar, 50 µm.

