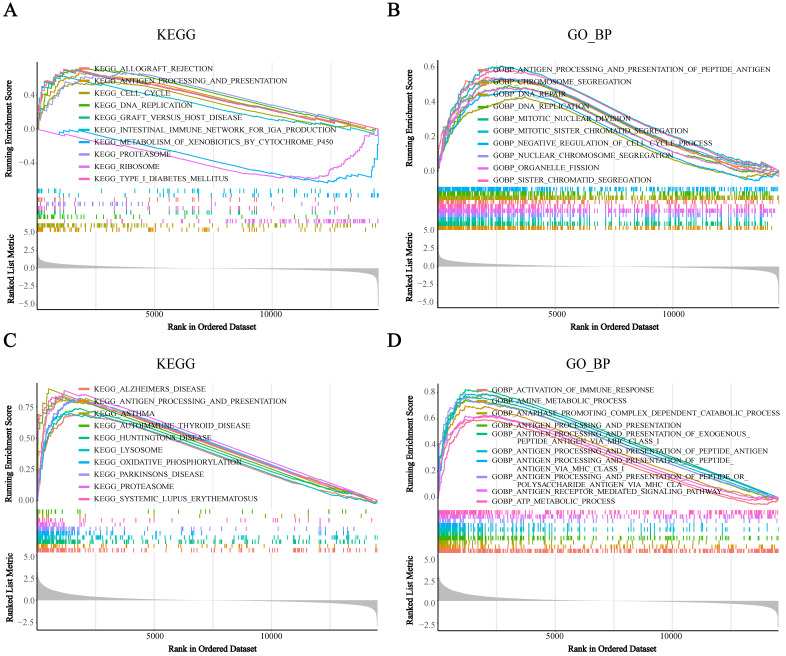
Figure 5.
Gene set enrichment analysis (GSEA) analysis was performed in the high-BST2 and low-BST2 groups in a single cell RNA-seq dataset (GSE146771). A KEGG analysis of tumor cells. B GO biological process (GO_BP) analysis of tumor cells. C KEGG analysis of monocyte/macrophage. D GO biological process (GO_BP) analysis of monocyte/macrophage.

