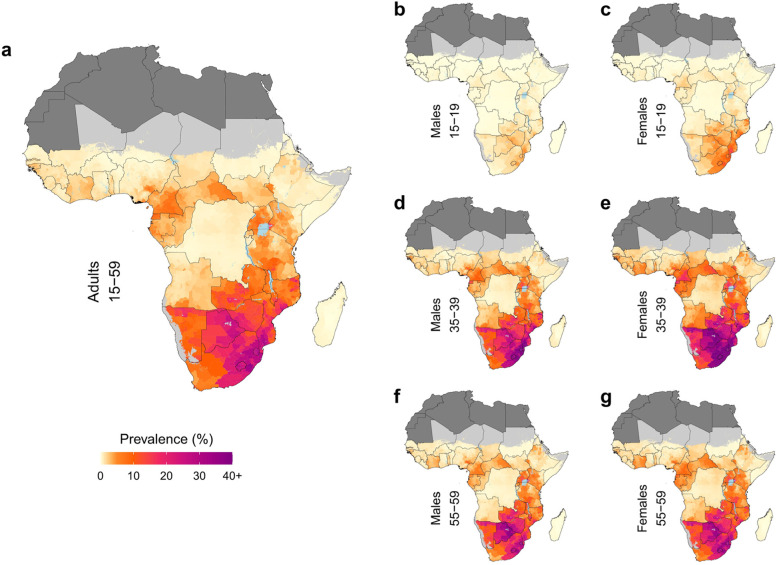
Fig. 3.
HIV prevalence in sub-Saharan Africa in 2018 at the second administrative level for a subset of modeled demographic groups from the lower, middle, and upper age ranges: a all adults, ages 15–59 years; b males and c females ages 15–19 years; d males and e females ages 35–39 years; and f males and g females ages 55–59 years. Maps reflect national boundaries, land cover, lakes, and population; areas with fewer than ten people per 1 × 1 km, and classified as barren or sparsely vegetated, are colored light gray. Countries colored in dark gray were not included in the analysis

