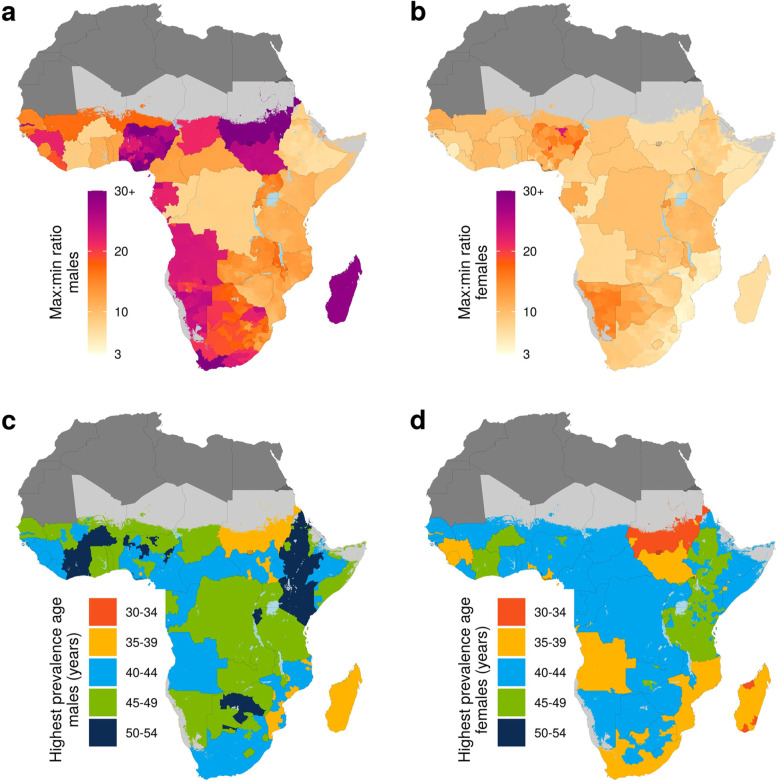
Fig. 6.
Differences in prevalence between age groups in the year 2018 at the second administrative level, calculated as the ratio of estimated prevalence between the age groups with highest and lowest prevalence, for a males b and females; and the age groups with highest prevalence for c males d and females in 2018. Maps reflect national boundaries, land cover, lakes, and population; areas with fewer than ten people per 1 × 1 km, and classified as barren or sparsely vegetated, are colored light gray. Countries colored in dark gray were not included in the analysis

