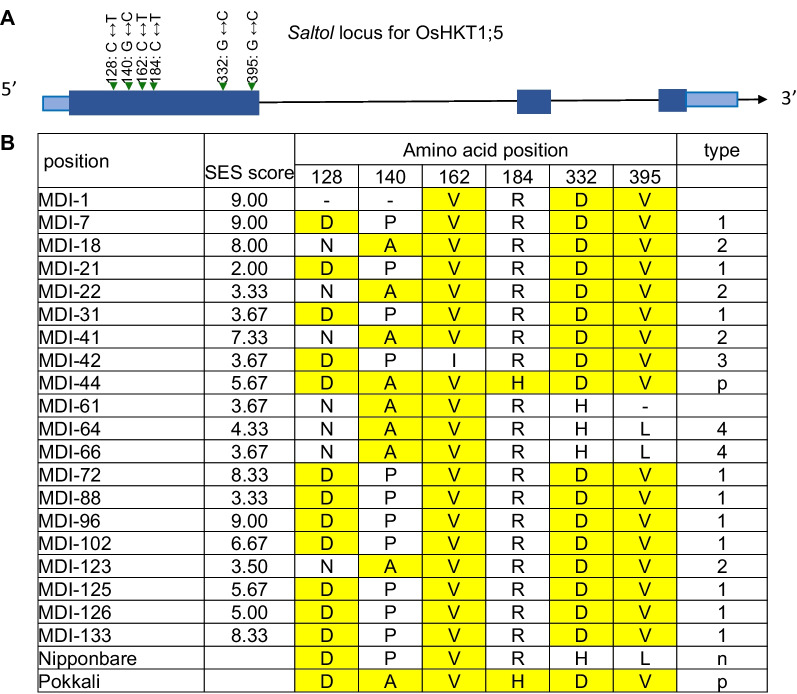
Fig. 4.
Comparison of amino acid sequences between 20 MDI accessions and Nona Bokra/Pokkali at OsHKT1;5 encoded by the Saltol locus. A Schematic diagram of the OsHKT1;5 gene. Dark blue boxes, exons; light blue boxes, untranslated regions; lines, introns. The six positions of 20 MDI accessions indicate the polymorphisms leading to nonsynonymous amino acid (aa) changes relative to the Saltol allele of the Nona Bokra/Pokkali accessions. B Haplotype analysis of nonsynonymous amino acid substitutions at the six sites defined above in each of the 20 MDI accessions. Yellow and (−) represent shared amino acids with Nona Bokra/Pokkali and undetermined amino acids

