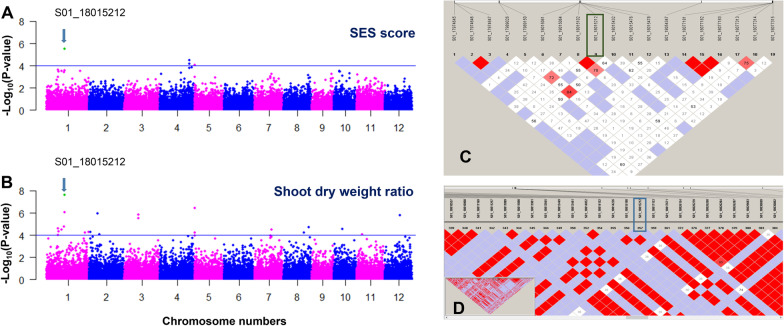
Fig. 5.
GWAS of salinity responses with SES scores and shoot dry weights for the MDI accessions. A Manhattan plot for SES scores with 29,881 imputed SNPs (Tam et al. 2019) from the 79 accessions at 20 DUT with 100 mM NaCl. B Manhattan plot for shoot dry weight ratio. Both analyses identified a single and identical SNP peak, S01_18015212, on chromosome 1. C Linkage disequilibrium (LD) analysis showing that S01_18015212 forms a single block using 19 SNPs within 200 kb obtained by RAD-seq analysis for the 79 accessions. D LD analysis using 657 SNPs from the 20 accessions, showing a single LD block within the 200-kb window

