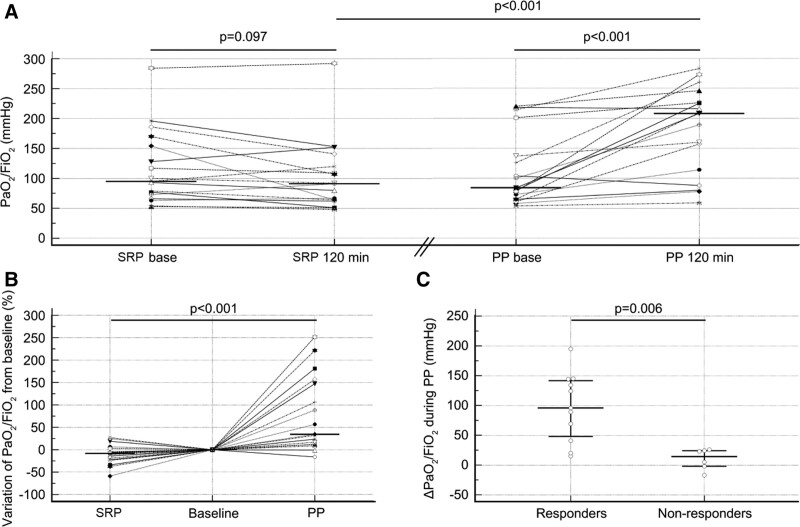
Figure 1.
Effects of the semirecumbent position (SRP) and prone position (PP) on the Pao2/Fio2 ratio. A, Dot plots and lines of Pao2/Fio2 at baseline and the end (120 min) of each period during the SRP and PP. The horizontal line indicates the median value. B, Dot plots and lines of the relative variation in Pao2/Fio2 during the SRP and PP, which was computed as 100 × (end value–baseline value)/baseline value. The baseline of each period was normalized to the reference level (zero). The horizontal line indicates the median value. C, Dot plots of the absolute variation in Pao2/Fio2 during the PP in the responders and nonresponders, which was computed as the end value–baseline value. The horizontal lines indicate the median values and the 25–75th percentiles. Among the six nonresponders, three had a ∆Pao2/Fio2 greater than 20 mm Hg.

