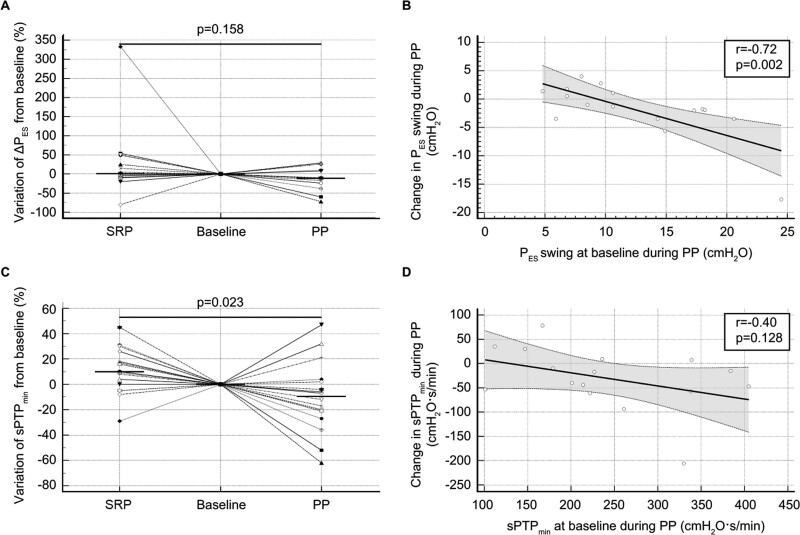
Figure 4.
Effects of the semirecumbent position (SRP) and prone position (PP) on inspiratory muscle effort. A, Dot plots and lines of the relative variation in the esophageal pressure swing (∆PES) during SRP and PP, which was computed as 100 × (end value–baseline value)/baseline value. The baseline of each period was normalized to the reference level (zero). The horizontal line indicates the median value. B, Scatter plot and regression analysis of the baseline ∆PES and the relative variation in ∆PES during the PP. The dashed lines indicate the 95% CI of the regression line. C, Dot plots and lines of the relative variation in the simplified esophageal pressure–time product per minute (sPTPmin) during the SRP and PP, which was computed as 100 × (end value–baseline value)/baseline value. The baseline of each period was normalized to the reference level (zero). The horizontal line indicates the median value. D, Scatter plot and regression analysis of the baseline sPTPmin and the relative variation in sPTPmin during the PP. The dashed lines indicate the 95% CI of the regression line.

