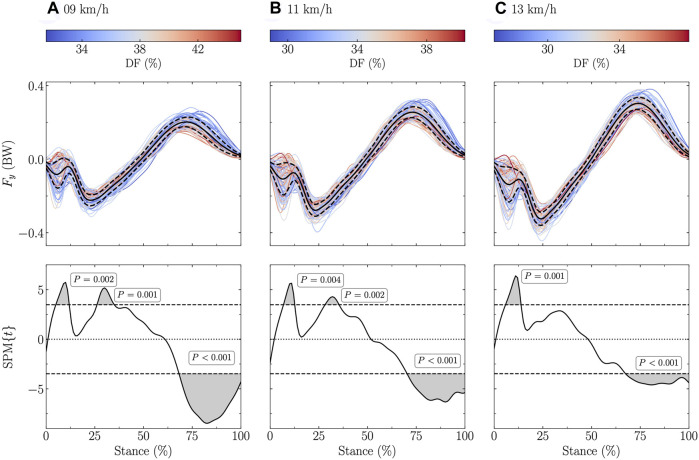
FIGURE 3.
Statistical parametric mapping (SPM) analysis, i.e., t-statistics (SPM{t}), of the linear relationship between the fore-aft ground reaction force (Fy) and the duty factor (DF) along the running stance phase at (A) 9 km/h, (B) 11 km/h, and (C) 13 km/h. In the upper panels, Fy, expressed in body weight (BW), is depicted for each participant (the color depends on the DF value) and for the mean (black line) ± standard deviation (dashed black line) over all participants. In the lower panels, the black dashed horizontal lines represent the critical (parametric) threshold while the portion of the running stance phase which is statistically significant (p ≤ 0.017; Bonferroni correction was applied to take into the three tested speeds) is given by the gray shaded area.

