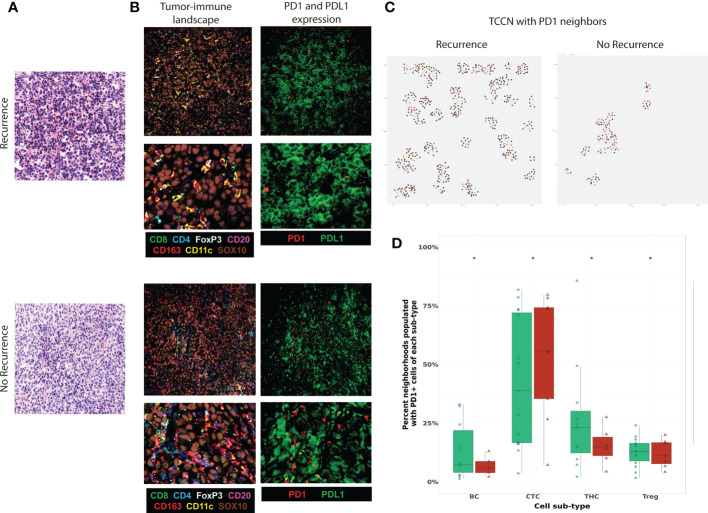
Figure 6.
Functional expression of PD1-PDL1 contextualized in the TCCN of the tumor-immune climate. (A) Virtual H&E of representative tumor FOVs. (B) MxIF overlay details tumor-immune landscape (TILs, myeloid cells, tumor cells) and PD1 and PDL1 expression in the same FOVs. (C) R plots identify spatial TCCN with at least one PD1+ neighbor (index tumor cell: teal, PD1+ cell: yellow, immune cell: purple, tumor cell: brown). (D) Box plot comparing frequency PD1+ TIL subsets as neighbors in TCCN between patients based on recurrence status. Distribution of patients displayed on box plot as green circles (no recurrence) and red triangles (recurrence). Acronyms are as follows B cells (BC), Cytotoxic T cell (CTC), T helper cells (THC), T regulatory cells (Treg). * indicates p value <0.01.

