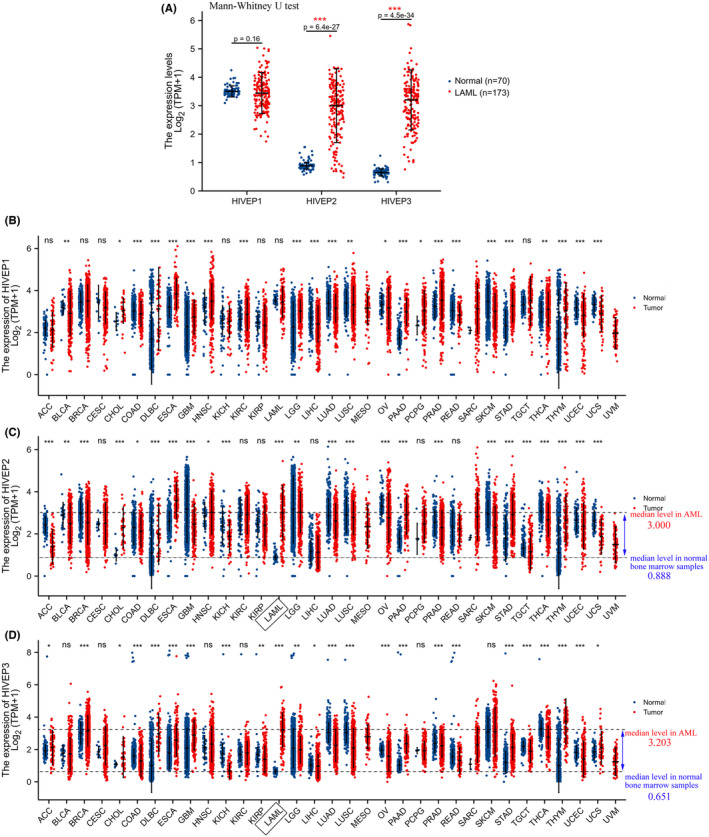
FIGURE 1.

HIVEP mRNA expression profiles in pan‐cancer. (A) Dot plots show the expression profiles of HIVEP1, HIVEP2, and HIVEP3 in bone marrow samples of patients in the TCGA‐AML cohort (n = 173) compared to those in normal samples (n = 70) from GTEx. Expression patterns of (B) HIVEP1, (C) HIVEP2, and (D) HIVEP3 were profiled in pan‐cancer. Expression analysis was conducted in RNA‐Seq datasets by R studio. The transcriptional levels were log‐transformed with the formula log2 (TPM + 1). A Mann–Whitney U test was used to evaluate the differences of expression levels between tumor and histologically healthy tissues with error bars designating median ± IQR. Gray dot lines indicate median mRNA levels. Asterisks denote different p values (*p < 0.05, **p < 0.01, ***p < 0.001). TPM, transcripts per kilobase million reads. IQR, interquartile range. ns, not significant
