
FIGURE 3.
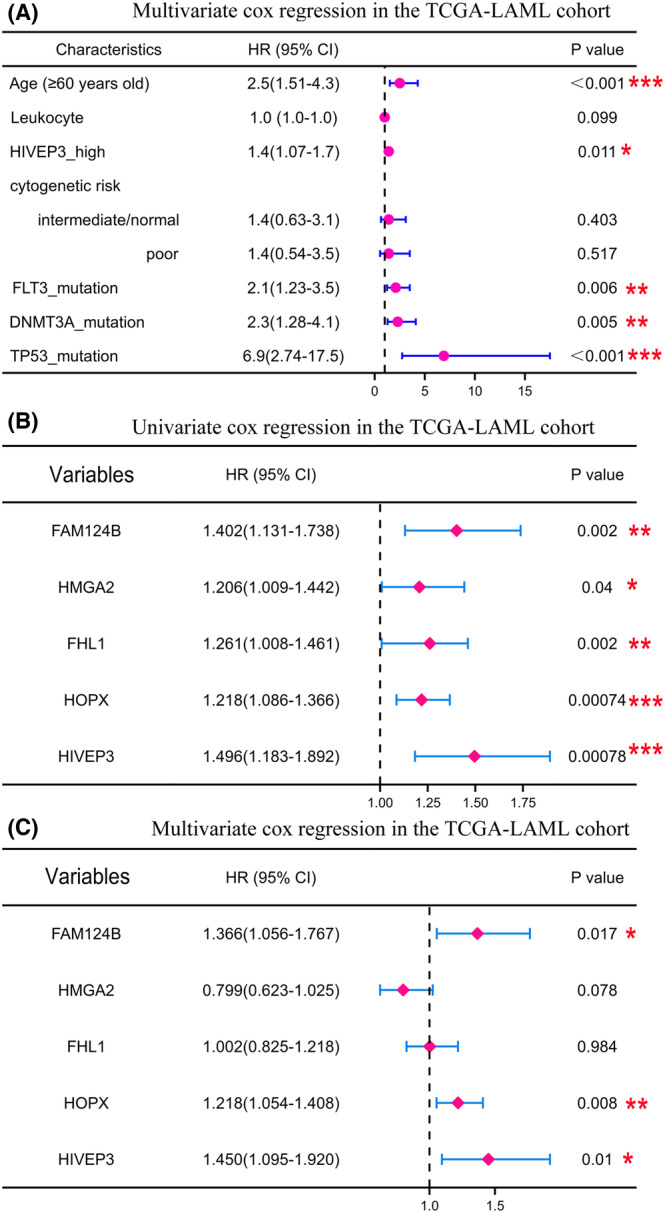
Prognostic capacity of HIVEP3 among multiple variables related to OS in AML patients. (A) The forest plots were generated in R studio by multivariate Cox regression analyses with HR, 95%CI, and p‐values. (B) Univariate and (C) multivariate Cox regression analyses were visualized in the forest plots to show the prognostic significance of a set of individual genes