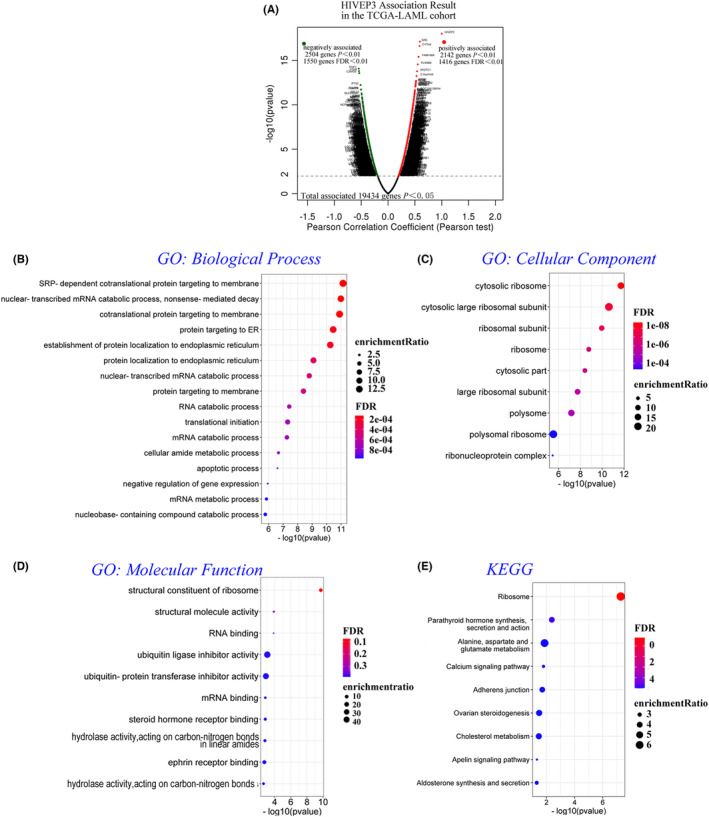
FIGURE 5.

HIVEP3 and co‐expressed genes were subjected to functional enrichment analyses in the TCGA‐AML cohort (WebGestalt). (A) The volcano plot of red and green dots assembles 19,434 HIVEP3 associated gene clusters in the TCGA‐AML cohort by Pearson's test (p < 0.05). One thousand four hundred and sixteen positively associated genes are represented in the right sector, while 1550 negatively associated genes are in the left sector (FDR < 0.01). (B–D) GO of three aspects including (B) biological processes, (C) cellular components, and (D) molecular functions, and (E) KEGG analyses were annotated by bubble charts. Bubbles in graded colors and various sizes illustrate the FDR and enrichment ratio of representative enrichment categories and pathways. Thresholding criterion was set at (−log10) p‐value = 1.3. FDR, false discovery rate
