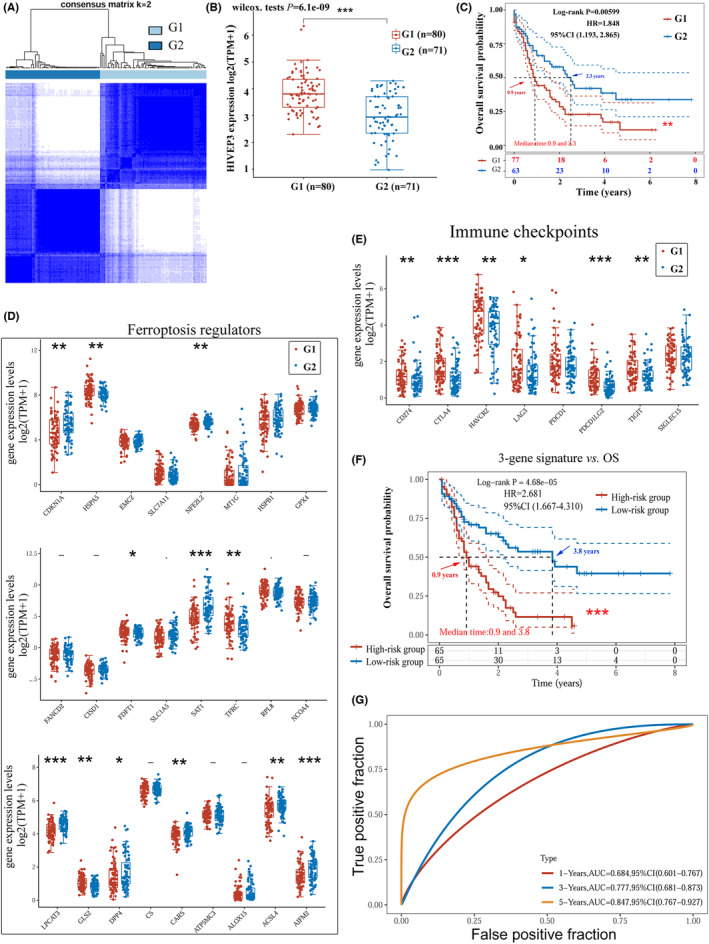
FIGURE 6.

Construction and assessment of the HIVEP3‐cored prognostic gene model by the LASSO regression. (A) The TCGA‐LAML cohort was clustered into G1 and G2 with a consensus clustering matrix for k = 2. (B) HIVEP3 expression levels in the two clusters (G1/G2). (C) Kaplan–Meier curves of OS for patients in G1/G2. Expression patterns of representative (D) ferroptosis regulators and (E) immune checkpoints in G1/G2. (F) Survival analysis of the three‐gene signature designated by LASSO. (G) Time‐dependent ROC analysis of the three‐gene signature for the 1‐, 3‐, 5‐year time points. The TCGA‐LAML cohort was grouped into a high‐risk score group and a low‐risk score group based on the risk score equation: riskscore = (0.0292) × HIVEP3 + (0.1576) × LPCAT3 + (0.1845) × AIFM2. Red and blue arrows indicate the median survival time
