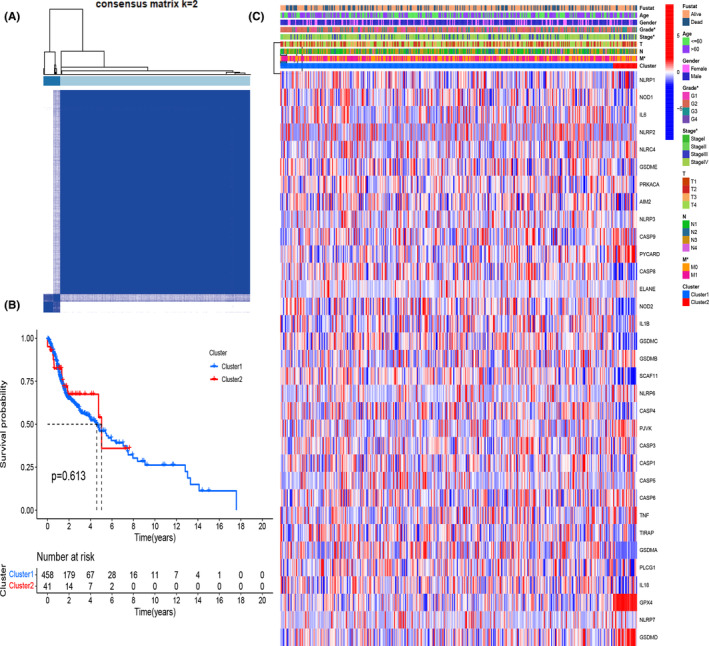
FIGURE 2.

Molecular subtype based on differentially expressed pyroptosis‐related genes. (A) Cluster analysis (k = 2). (B) Kaplan–Meier curves of two clusters. (C) Heatmap displayed the expression levels of 33 pyroptosis‐related genes and the clinical characteristics of two clusters
