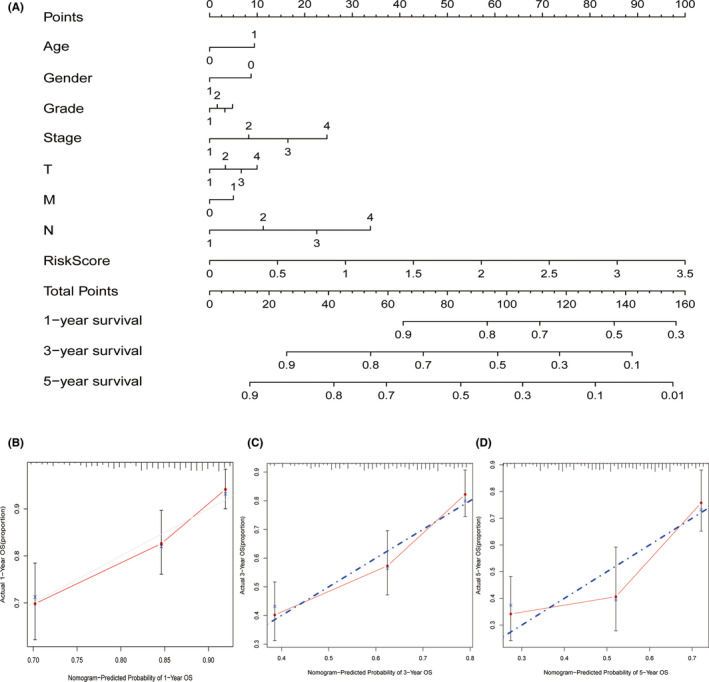
FIGURE 4.

Establishment of a predictive nomogram. (A) Nomogram to predict 1‐, 3‐, and 5‐year survival rate of HNSCC patients. (B) Calibration curves of the nomogram predicting survival rate of HNSCC patients in the validation cohort (x‐axis: predicted survival probabilities; y‐axis: actual observed survival probabilities)
